
by Bob Shively, Enerdynamics President and Lead Facilitator
As low load growth, increasing renewable generation, closing of traditional baseload fossil fuel plants, growth of distributed resources, and decreasing cost of storage have all become a reality, energy utilities are forced to rethink business models that have worked well for many years. In Energy Currents, we are exploring various utilities’ responses to the changing energy business. In today’s blog, we explore the New York utility Con Edison.
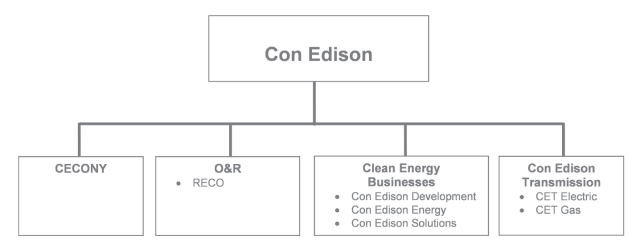 Source: Con Edison Annual Report 2016
These include Consolidated Edison Company of NY (CECONY), which delivers electricity, natural gas, and steam to more than 3 million customers in New York City and Westchester County; Orange and Rockland Utilities (O&R), which together with its subsidiary, Rockland Electric Company, delivers electricity and natural gas to more than 300,000 customers primarily located in southeastern New York State and northern New Jersey; Con Edison Clean Energy Businesses, which develops, owns, and operates renewable and energy infrastructure projects and provides energy-related products and services to wholesale and retail customers in 13 states; and Con Edison Transmission, which through its subsidiaries invests in electric and gas transmission projects.

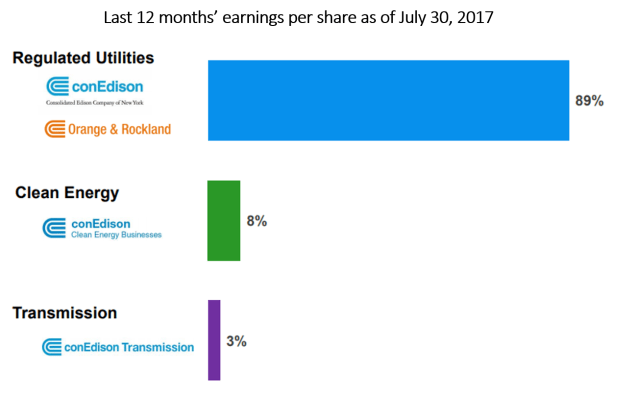
Source: Con Edison
The majority of Con Ed’s earnings come from its utilities, and this is expected to continue:
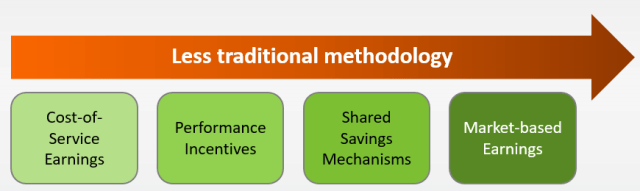
Source: Con Edison presentation of Wolfe Utilities and Power Conference, September 27, 2017
The utilities primarily own electric transmission and distribution facilities, gas distribution facilities, and a district steam system. The only electric generation owned by the utilities is a 726 MW electric-steam facility in New York City. All consumers have the option of buying electric and gas supply from their utility under regulated rates or buying from retail marketers under competitive pricing. In 2016, CECONY was the supplier for 35% of the electricity and 71% percent of the gas delivered to its customers; O&R was the supplier for 41% of the electricity and 48% of the gas delivered to its customers. The remainder was purchased by customers from retail marketers rather than the utility (the utility still receives distribution revenues from these customers). To service customers who take supply from the utilities, gas and electricity is purchased in the wholesale market through long-term and spot transactions. The electric transmission grid, although owned by the utilities, is operated by the New York ISO, which also runs capacity, day-ahead ancillary services, day-ahead energy, and real-time energy markets.
The utilities are primarily regulated using the cost-of-service model. Distribution facilities are regulated by the New York State Public Services Commission (NYSPSC), and electric transmission facilities are regulated by the Federal Energy Regulatory Commission (FERC). The cost of supply provided by the utilities is passed through to customers. Revenue decoupling applies so that actual revenues are adjusted to match approved revenues, and the utilities are not at risk for revenue fluctuations associated with how many kWh are sold. The utilities can receive a negative revenue adjustment for failure to meet certain service standards (penalties can be as high as $400 million on the electric side, but in 2016 the utilities did not incur any penalties). There is an incentive-based earning adjustment mechanism for energy efficiency over the period 2017–2019 that potentially can range from $28 to $64 million for CECONY. If overall earnings exceed a threshold amount (typically about 0.5% above the authorized rate of return) then excess earnings are used for customer benefit rather than for profits.
New York has implemented rules that require load serving entities (LSEs) such as the utilities to achieve a Renewable Portfolio Standard (RPS) of 50% by 2030, to reduce greenhouse gas emissions by 40% by 2030, and to purchase Zero Emissions Credits to support the continued operation of nuclear power plants in upstate New York.
The business model and services for all New York utilities are being reformed through the NYSPSC proceeding called Reforming the Energy Vision. As stated in the Con Edison Annual Report 2016:
“In April 2014, the NYSPSC instituted its REV proceeding, the goals of which are to improve electric system efficiency and reliability, encourage renewable energy resources, support distributed energy resources (DER) and empower customer choice. In this proceeding, the NYSPSC is examining the establishment of a distributed system platform to manage and coordinate DER, and provide customers with market data and tools to manage their energy use. The NYSPSC also is examining how its regulatory practices should be modified to incent utility practices to promote REV objectives.”
The proceeding has passed through initial phases but reform is expected to be implemented over many years. One of the concepts is that earnings will evolve from cost-of-service to performance incentives, shared saving mechanisms, and market-based earnings as shown on the graphic below. It is expected that, over time, more and more utility earnings will come from less traditional methods.
A recent decision in the REV proceeding required the utilities to file demonstration projects for approval by NYSPSC staff. Costs for these projects are recovered through a surcharge. Projects include an O&R online engagement platform that leverages residential customer data and analytics to help customers find energy products and services that meet their needs, and three CECONY projects. CECONY projects include a clean energy project origination, bidding and technical support platform for small commercial customers; a clean virtual power plant offering that bundles solar with storage that can be aggregated and also can test the demand for premium reliability services; and a marketing platform for distributed energy providers to target residential customers with relevant messaging.
Also in recent years, CECONY has utilized payments to customers providing distributed energy resources (DERs) to defer upgrades to the transmission and distribution systems serving growing areas. It also is currently watching (but not participating in except in the role of the distribution provider) the Brooklyn Microgrid Transactive Grid project, which is designed to ultimately allow customers with DERs to trade power directly between themselves using blockchain technology.
Volumes of distributed energy on the utility systems have been relatively limited to date but are growing. Distributed generation comprised approximately 3% of peak demand in 2016:
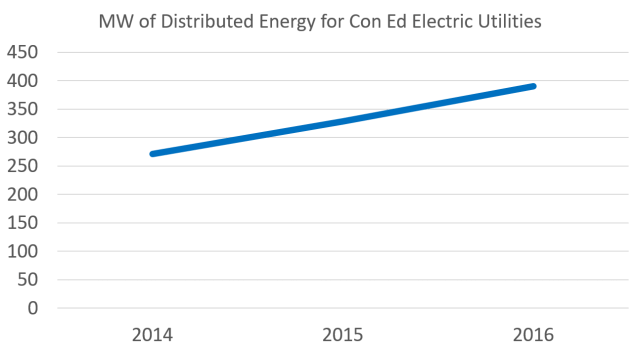
Source: Con Edison 2016 10Q
Due to policy decisions made by the State of New York and the NYSPC, Con Ed must transform its utility business model over the next few years. The transition is critical for the company since close to 90% of Con Ed’s earnings come from its two utilities. Con Ed and other New York utilities will be on the leading edge of changing the utility role from an energy-delivery utility to a distribution services platform provider. Over time, the NYSPSC expects that utilities in New York will transform their earnings model with less and less of earnings based on traditional cost-of-service. How Con Ed manages this transition will be critical to its future and will provide a case study for utilities across the world as they plan their own transitions.

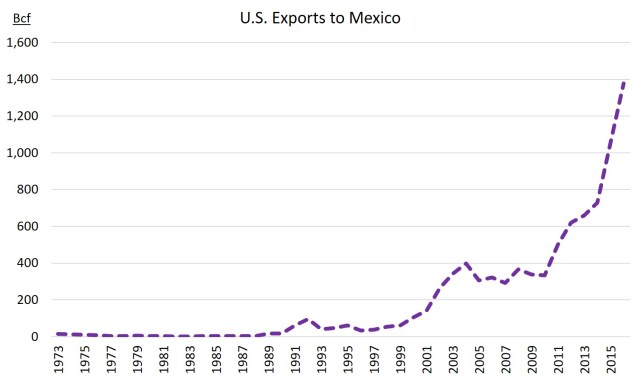
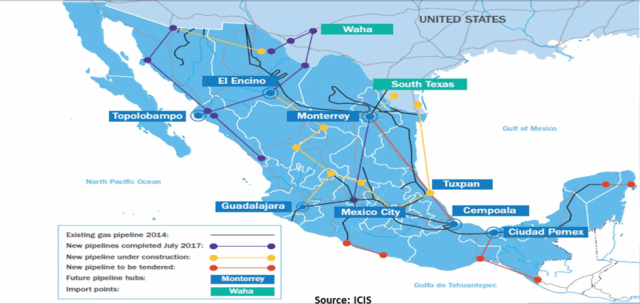 Source: ICIS webinar – Mexico’s New Gas Market, October 5, 2017


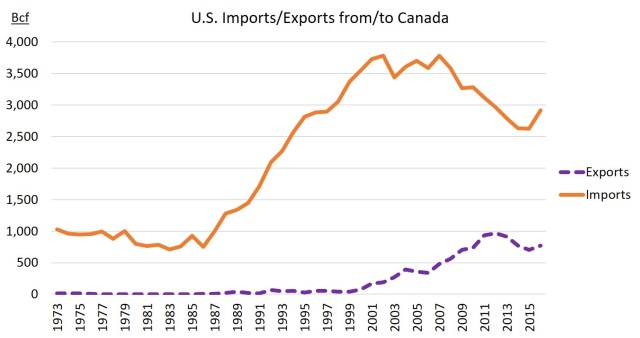
 Source: EIA Today in Energy


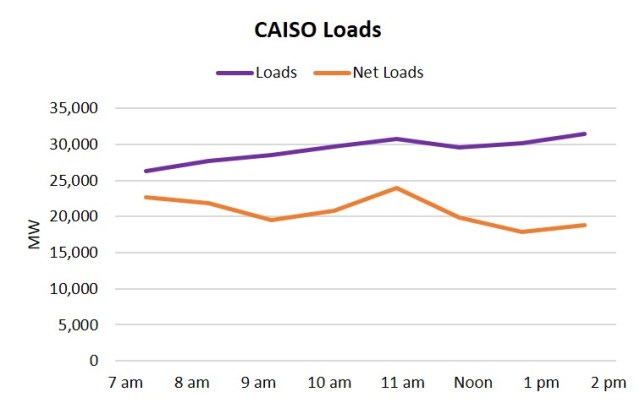
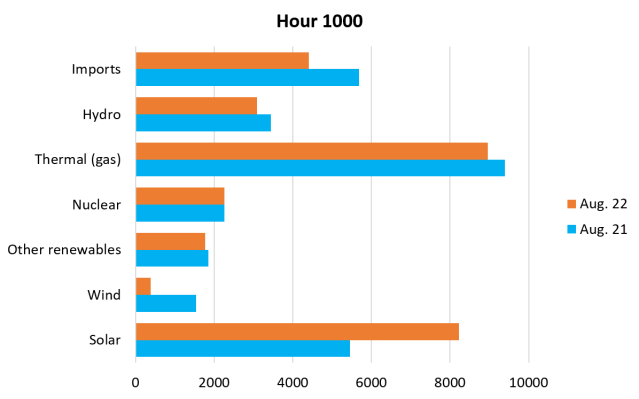
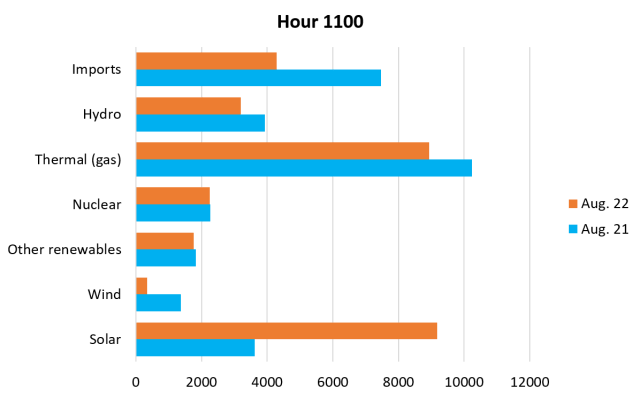
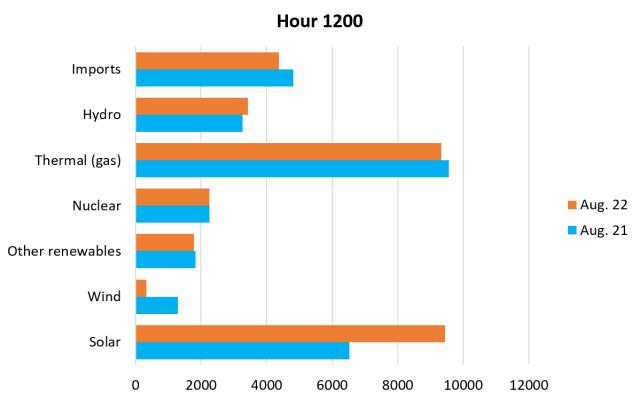
 Source: CAISO Renewables Watch, August 22, 2017


 Source: Brattle Group,