In the 1920s, cruise ships made a leap in transportation fuel from coal to heavy fuel oil.  Since that time, the industry has vastly expanded with luxury liners sailing on nearly every ocean while pampering passengers with well-appointed rooms, fine dining, theme-park amenities, and Broadway-style stage shows.
While the cruise ship experience has evolved, the ships’ fuel remains heavy oil, but that may soon change. In Fall 2018, Carnival Corporation (Carnival) is set to take delivery of the world’s first liquefied natural gas (LNG)-powered cruise ship. With 15 additional LNG-fueled ships on order for three companies in the cruise line industry, the dawn of the LNG-fueled cruise ship era appears to be on the horizon.
Environmental regulations
Concern for the environment is driving the change in fuel as regulations from the International Maritime Organization (IMO) become more stringent to reduce exhaust gas emissions. Conventional cruise ships produce air pollution that includes sulfur dioxide, nitrous oxide, carbon dioxide, carbon monoxide, and particulate matter. LNG does not produce sulfur oxides and emits less nitrous oxide and less particulates. Traditional heavy oil has been a fuel mainstay because it is cheaper than low-sulfur fuels, but adding scrubbers to reduce pollutants is expensive and can off-set some of the initial savings. Currently, LNG is cheaper than low-sulfur fuel, but not cheaper than heavy oil. So environmental regulations, not price, may be the catalyst for the industry to switch from heavy oil to LNG.
Carnival leads the way
Carnival, the world’s largest cruise ship company, is leading the transformation from heavy oil to LNG. The company, which owns 10 brands, has ordered seven LNG-powered ships to be used by several of its cruise lines: AIDA Cruises, Carnival Cruise Lines, Costa Cruises, and P&O Cruises. Meyer Werft laid the keel for the first ship, AIDAnova, in September at its facility in Papenburg, Germany. The ship is scheduled for completion in about a year; the remaining six ships will be delivered between 2018 and 2022 and will be built by Meyer Werft and Meyer Turku in Finland. The AIDAnova will be the first ship to burn LNG – both on land and at sea – as its primary fuel. All new ships will be dual-fuel vessels that also can burn marine gas oil.
Other cruise vacation companies also are turning to LNG. Disney Cruise Line will take delivery of three new LNG-fueled ships between 2021 and 2023 from Meyer Werft. MSC Cruises has four LNG-powered ships on order for delivery between 2022 and 2026. The ships will be built by STX France. Lastly, Meyer Terku is building two new hybrid LNG-powered ships for Royal Caribbean Cruises that will be ready in 2022 and 2024. Royal Caribbean also plans to test fuel cell technology on future ships.
Infrastructure
Infrastructure and fuel distribution are critical to the success of the cruise ship industry’s fuel transition. Said Tom Strang, Senior Vice President for Maritime Affairs for Carnival: “We have to build it…It’s not something you can just turn up and buy in the way you can with marine-gas oil or heavy fuel.” [1]
To that end, Carnival signed an agreement with Royal Dutch Shell to purchase LNG for the first of its two new LNG-fueled ships. One ship will receive gas from an LNG bunker vessel at the Gas Access to Europe (GATE) terminal in Rotterdam, the Netherlands, while the other ship will refuel at available Western Mediterranean ports. Fortunately, significant LNG infrastructure exists in Europe to accommodate the needs of the cruise ship industry. Disney is considering sites at Port Canaveral, Florida – the departure point for many of its cruises – as a fuel storage and LNG distribution point.

The next few years will see the delivery of 16 cruise ships all powered by LNG and the development of a global fueling infrastructure to accompany it. It’s the largest fuel-related change in the cruise line industry in almost a century and largely reflects the industry’s growing commitment to a cleaner environment. Carnival, Royal Caribbean, and Disney are leading the charge for now, but the potential for ferry services and other cruise line companies to jump on board will only solidify this ever-growing market niche.
Footnotes:
[1] Stieghorst, Tom, “The Future of Cruise Propulsion: Increasingly LNG Fuels New Builds,” Travel Weekly, September 11, 2016.

 Attention Energy Currents readers!

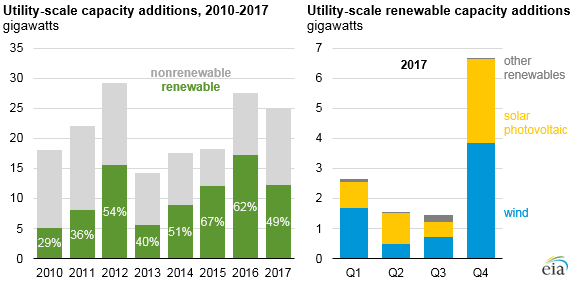


 The Canadian province of Alberta announced results of its long-term power auction in December 2017. Through the auction the province selected 600 MW of wind power at a price of $37/MWh.
 with 42.3 MW of wind with a median price of $18.10/MWh, 29.7 MW of solar at $29.50/MWh, 5.7 MW of wind/battery projects at $21/MWh, and 16.7 MW of solar/battery projects at $30.60/MWh.
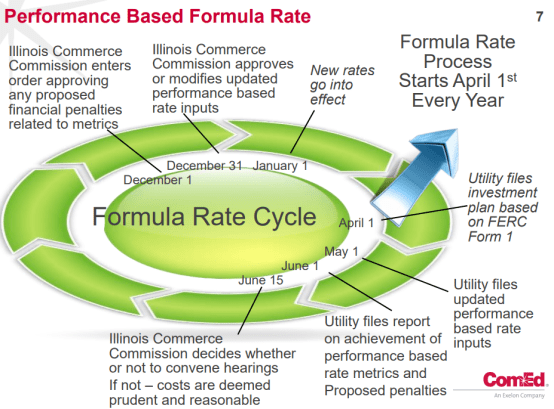
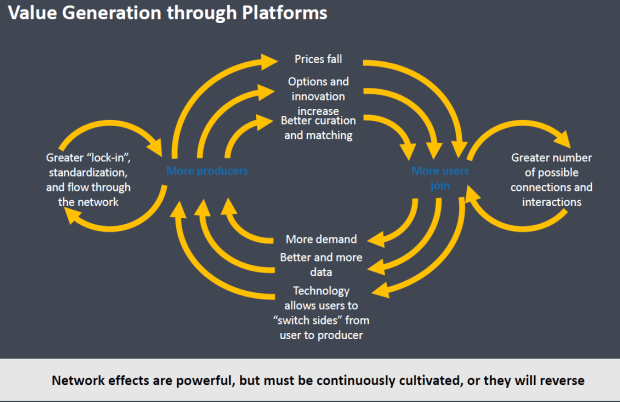
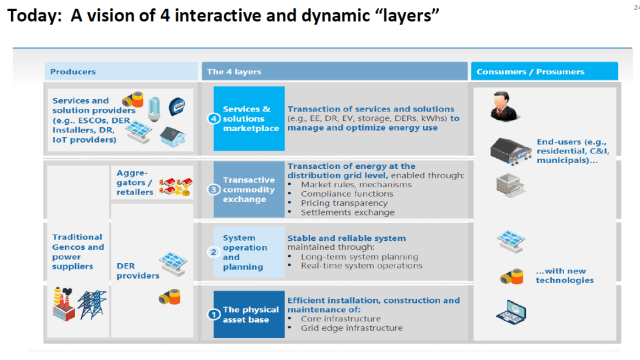 Source: Perspectives in Grid Transformation from Illinois, Jane S. Park, Com Ed VP of Regulatory and Policy, November 2, 2017


 Paths gives employees a complete overview of the electric or gas industry in just one hour — and in a fun and interactive online format.
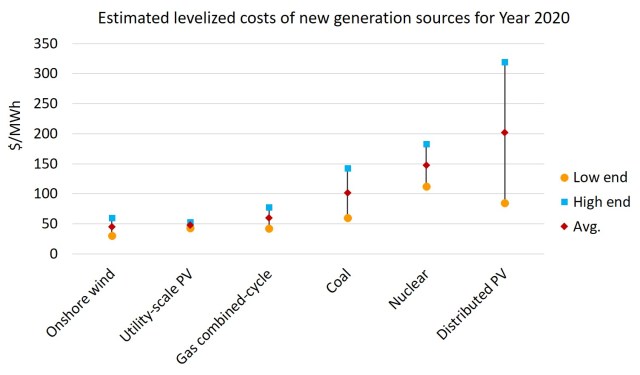
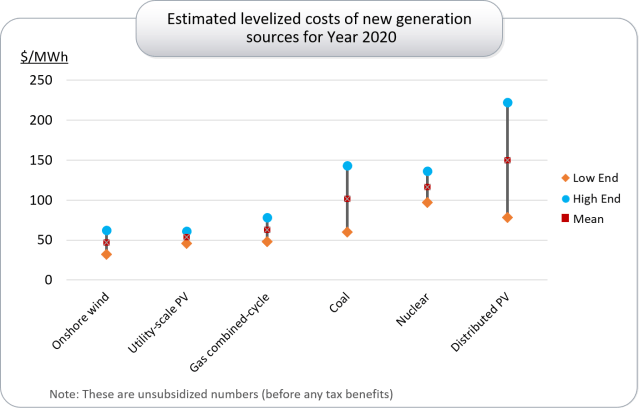 Source: Lazard Levelized Cost of Energy Analysis – Version 10.0


