
by Bob Shively, Enerdynamics President and Lead Facilitator
In the weeks leading up to the Aug. 21 solar eclipse, numerous articles appeared questioning whether U.S. power grids could handle the expected loss of solar power. This map from the Energy Information Administration (EIA) shows the path of the eclipse across a map of utility-scale solar generation:

Source: EIA Today in Energy, August 7, 2017
At least 10 states were expected to see significant impacts:

Source: EIA Today in Energy, August 7, 2017
The results of Monday’s test indicate that the grid was more than ready to handle the event: No negative operational effects were noted. Said Eric Schmitt, CAISO vice president of operations: “We didn’t have any major challenges on the system, even minor challenges. We are very pleased about how smoothly it went … All the resources performed the way they were supposed to perform, our planning was excellent (and) the market performed well.”[1]
Let’s take a look at how California managed the loss of solar power.
Normal Operations vs. Eclipse Operations
The following graphs show California ISO (CAISO) renewable output for the day of the eclipse compared to the day prior:

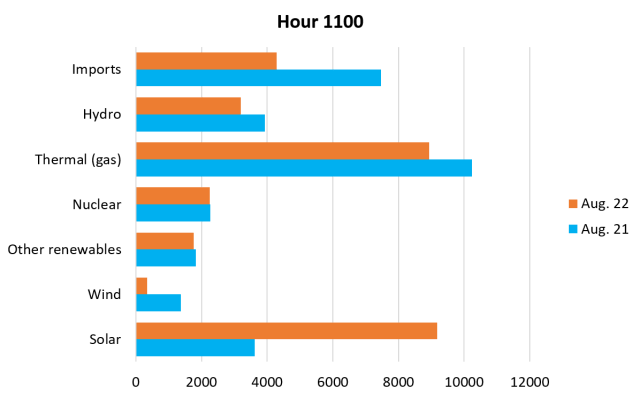
For hour 1100, when the eclipse was at maximum, solar power on Aug. 21 was at 3,613 MW compared to 8,599 MW for the same hour the next day. Note that this only reflects utility-scale solar power, as additional impacts from rooftop solar are hidden by the fact that the CAISO sees loss of distributed solar as additional load. (California is estimated to have 1,300 MW of rooftop solar, so we might guess an additional 500 to 700 MW was lost during the height of the eclipse.)
How CAISO Handled the Loss of Solar Power
By looking at a series of hourly charts of generation sources comparing output on Aug. 21 and Aug. 22, we can see how the CAISO compensated for reduced solar output:
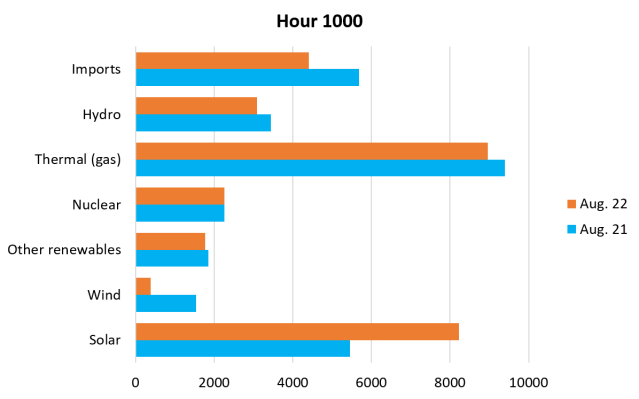

The charts reveal a few key points:
- California got lucky in that it was windier than normal during the eclipse, contributing extra wind power just when it was needed.
- To compensate for the loss of solar during the eclipse, CAISO imported more power from outside the state, used more hydro, and used more gas generation.
- As solar power ramped back up as the eclipse waned, the CAISO first used the flexibility in hydro power and reducing imports to absorb the increasing solar power, then reduced gas output.
- Although not visible in these charts, it is also possible there was some purposeful demand response that reduced load during the eclipse (in addition to the natural reduction in cooling loads). For example, Nest offered its customers a special Solar Eclipse Rush Hour program that used their Nest thermostats to precool their homes, and then reduce cooling loads during the eclipse.
System Operator Tools Allow Variable Resources to be Managed
We can conclude that the multiple tools helped make the eclipse a non-event as far as the California grid was concerned. These included diversity of renewable technologies, ability to draw on power from other regions through geographical diversity, availability of fast ramp assets including hydro power and natural gas generation, and demand response. Now this was a little easier because CAISO knew the event was coming and could plan for it. Indeed, IEEE Specturm reported that CAISO held extra reserves of 800 to 1,000 MW, whereas they would normally hold about 350 MW during this time period. But, by studying the eclipse, we can get a vision of the future of the power grid, when variable resources will not negatively impact reliability because the system operators will know how to use their various tools to keep things running smoothly.
Footnotes
[1] “Grid runs smoothly in California during the eclipse”, The San Diego Union-Tribune, Wednesday, August 23, 2017
