
by Bob Shively, Enerdynamics President and Lead Facilitator
Not an energy trader? You might be grateful for that. Predicting price behavior is seemingly harder and harder. History would tell us that in regions with high penetrations of renewables, an event that reduces renewable output should result in higher electricity prices. And based on the past, we all think that a major storm in the Gulf should cause natural gas prices to spike. If you think this all makes sense, it is worth taking a deeper look at prices during these two recent events.
The Solar Eclipse in California
California is becoming more and more dependent on solar power. Here is a typical summer day for the California ISO:
 Source: CAISO Renewables Watch, August 22, 2017
As discussed in last week’s blog, the large bulge in renewables is due to plentiful solar power. But as also discussed last week, renewable output predictably declined during the eclipse:

Now let’s look at price behaviors:

In the day ahead, buyers assumed prices would rise during the hour starting at 10 a.m., as the sun became obscured and solar power dropped. This was based on the maximum eclipse occurring around 10:15 a.m. The result was a day-ahead price of $52/MWh, which likely signals that gas-peaking units were successful in the day-ahead price auction. What happened in real-time? Prices began dropping during the height of the eclipse! And then as the sun started coming back, prices fell below zero.
To get a full picture, we also need to look at the load curve:
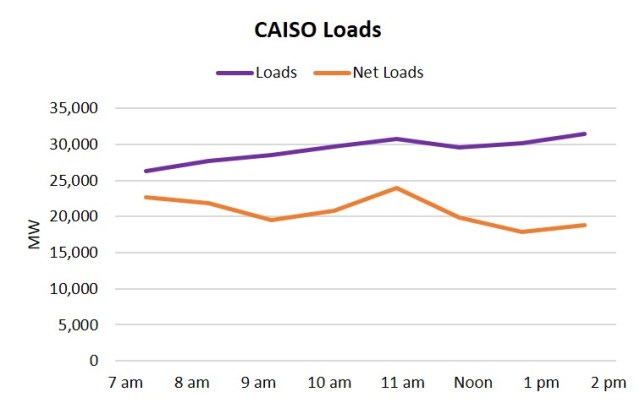
Here we see total loads (the purple line) and net loads (the orange line). Net loads are total load minus renewable output, which represents the amount that must be served by traditional forms of generation or by imports. Notice that net loads were low during the early hours of the eclipse (9 and 10) but then climbed in hour 11. Why were net loads low during the height of the eclipse? Partially because the eclipse cooled the air, meaning that air conditioning loads dropped. Some have also speculated that numerous people were outside observing during this time rather than using electrical devices in their homes and businesses, so load also dropped due to consumer behavior.
So now we;ve explained why real-time prices moderated during hour 10. But we still haven’t explained why prices fell during hour 11, when the net load was rising as people quit looking at the sun and headed back indoors. To understand this, let’s look at one more graph:

Here we see the value of the of the Western Energy Imbalance Market (EIM). As net loads grew, California was able to buy cheap import power, which instead of driving prices up drove them down. This, coupled with gas plants that couldn’t get off-line fast enough, resulted in prices falling dramatically.
And now you see how hard it is to predict price behavior during unusual events. Next week we will delve into the issue of natural gas prices during Tropical Storm Harvey.
Want to learn more about how electric wholesale prices are set and how markets behave? Enerdynamics offers both live and online Wholesale Power Markets seminars. See www. enerdynamics.com for more details.
