
by Bob Shively, Enerdynamics President and Lead Instructor
“From the decline of coal power to the rise of energy storage, big changes are taking hold in the industry…changes are taking hold faster than many expected. The electric sector is no longer simply anticipating a revolution – depending on where you are, it is embroiled in one today”[1]
Since the widespread advent of air conditioning in the U.S., the electric industry has had fairly predictable shapes to load curves. While system operators and T&D design engineers had uncertainty about year-to-year load growth, the shapes of the curves was predictable. Typical curves looked like the following for a large operating region:
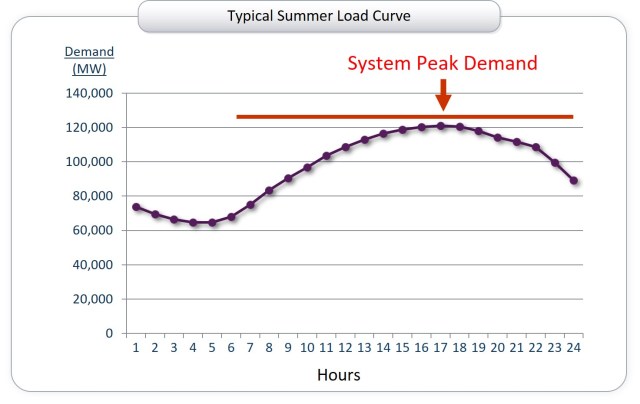
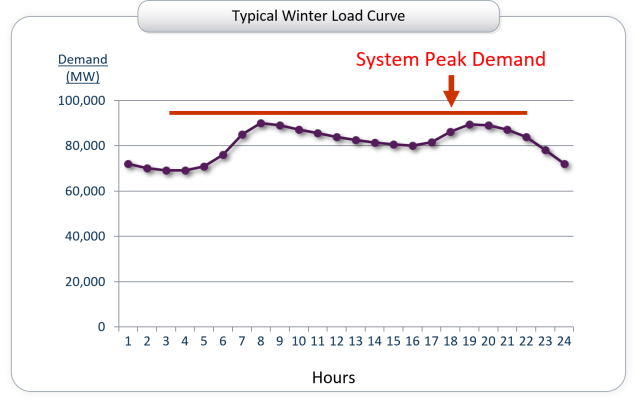
Predictable shapes allowed system operators to consistently plan for load variability given weather forecasts. Similar curve shapes applied to the specific load on many distribution circuits serving residential and commercial loads giving transmission and distribution engineers a predictable pattern of demand to design for.
But as penetrations of renewables increase, system operators and engineers must design for new criteria – loads minus renewable output. On the system level this tells operators how much traditional generation must be available and/or operating at any given point in the day. At the distribution circuit level, it tells engineers what power flows they must design the circuit to reliably carry. As you might imagine, net load curves are fundamentally changing. At the system level, the shape of the curve has changed to a curve that looks somewhat like the back of a duck, hence that is called the “duck curve”:
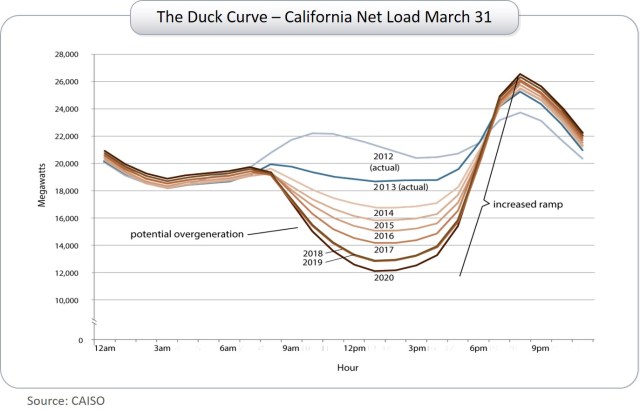
The above graph showing expected net loads in the California ISO (CAISO) systems demonstrates just how quickly things are changing. By 2020, mid-day net loads are expected to have dropped from 20,000 MW to 12,000 MW during high solar hours.
When net loads are observed on specific circuits with high penetration of solar, results are even more dramatic. Here are net loads on a representative circuit in Hawaii:
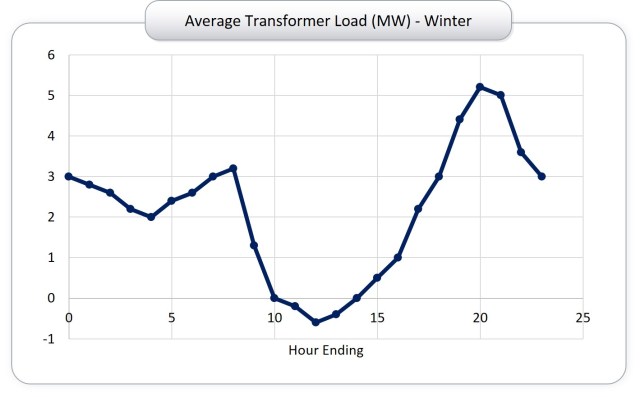
Note that for certain high solar hours the circuit has negative net load, which means that power is back loading into the distribution substation and back into the transmission line. In other hours, the circuit has a net load greater than 5 MW. In Hawaii, with rapidly growing solar installations, this curve has been referred to as the Loch Ness Monster since loads “disappear under the water” and are not visible to the system.
In an earlier blog post, we explored how the island of Kauai is dealing with this issue. As the above load curves show, system operators and system engineers around the country will need to learn from areas like Hawaii and California that have high early penetrations of renewable energy and prepare themselves for load curve changes when significant amounts of renewables come to their systems.
Footnotes:
[1] From “The Top 10 Trends Transforming the Electric Power Sector,” Utility Dive, September 17, 2015

Pingback: Storage Changing Paradigms in Electric System Design and Operations | Enerdynamics
Pingback: A Look at Blockchain Technology and Electric Trading | Enerdynamics