by Bob Shively, Enerdynamics President and Lead Facilitator

Wailua Falls in Kauai, Hawaii
The state of Hawaii has made it law that by 2030 40% of electricity used by utilities mustbe generated by renewable sources and that 100% will come from renewables by 2045. Many wonder how this will be possible, especially in a state with separate unconnected electrical grids on each of the six main islands. For a vision of how this is possible, let’s look at the island of Kauai, which is already moving down the path to 100% renewables[1]:
- Kauai generated 38% of its power from renewables in 2015.
- For short periods in the month of January 2106, Kauai ran its system on over 90% renewables.
- The Kauai Island Utility Cooperative (KIUC) that serves the island plans to generate more than 50% from renewables by 2023.
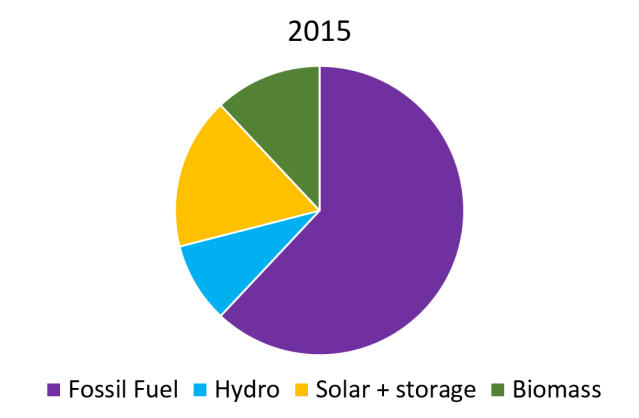
The following charts demonstrate Kauai’s shift from fossil fuels to renewables:


According to the Regulatory Assistance Project (RAP)[1], there are 10 key strategies for running an electric grid with high penetrations of renewables:
- Targeted efficiency that reduces demand in key hours
- Peak-oriented renewables that provide output during high-demand hours
- Managing water pumping to reduce pumping loads during ramping hours or times when renewables output is low
- Controlling electric water heaters to heat water during night and mid-day hours
- Converting commercial air-conditioning to utilize ice or chilled water storage
- Adapting rate design to focus on time-of-use that charges high prices during crucial hours and avoids high fixed charges
- Deploying electric storage for targeted purposes
- Deploying demand response programs to reduce loads during critical hours
- Developing programs for inter-regional power exchange to allow import/export to regions with different peaking period or different renewables output
- Replacing inflexible generating plants with flexible resources
To understand how a tiny island like Kauai can turn these strategies into a successful high-penetration renewables plan, it’s important to have some background on its exclusive utility, KIUC[3]:
- KIUC, a customer-owned cooperative, is the exclusive provider of electricity on the island of Kauai.
- There is no interconnection to other islands.
- KIUC traditionally served the island with 121.3 MW of fossil fuel generation and 1.3 MW of hydro capacity.
- The current system peak demand is approximately 73 MW.
- System load typically varies from a low of about 30 MW to a peak of 70 MW. Peaks occur in the early evening, and day-time loads average between 60 to 65 MW.
- Given the load shape, a key challenge for KIUC as solar penetration grows is to “move” solar generation from mid-day to the evening peak.
- Annual energy sales are over 425,000 MWh.
Now let’s take a look at how KIUC has applied the RAP principles:
Targeted efficiency — KIUC has an active Energy Wise conservation program that includes services around efficient lighting, heat pump water heaters, efficient appliance replacement including ceiling fans and window air-conditioners, appliance meter testing, and a commercial retrofit program.
Peak renewables — KIUC has encouraged development of both utility and customer-owned solar photovoltaic (PV) resources. KIUC has installed 24 MW of utility PV generation while customer-owned had exceeded 20 MW with installations at over 3,000 customer locations (10% of its customer base).
Managed water pumping — Water pumping is not a big load on Kauai, so KIUC has not found this to be a key area to pursue.
Controlled water heaters — KIUC has concentrated on reducing hot water demand through a solar hot water heater that offers $1,000 rebates plus low- or no-interest loans and rebates on heat pump water heaters that significantly increase the efficiency of water heating. This is important because water heating is often the largest use of energy in customers’ homes.
Controlled air conditioning — As mentioned above, ceiling fans and air conditioners are a key component of KIUC’s energy efficiency programs. Especially important is cooling in the commercial sector, which can make up 30% of commercial loads. KIUC’s commercial retrofit program offers incentives that can cover 50 to 100% of the cost of retrofitting commercial premises.
Focused rate design — KIUC started a pilot program with 300 customers to shift demand to the high solar hours. The program offers customers a 25% rate discount for all power used during the hours of 9 a.m. and 3 p.m. This is of note because most time-of-use rate structures encourage customers to use energy in night-time hours, not during the solar peak.
Energy storage — KIUC is working to develop pumped hydro projects that are planned to provide 25 MW of storage by 2019. These projects are designed to pump water during the mid-day solar peak and use the water to generate power during the evening hours. KIUC currently has 10.5 MW of battery storage. This includes 4.5 MW of grid storage and 6MW of storage at the Anahola solar array to handle short-term fluctuations in solar output. KIUC also signed a power supply agreement with SolarCity for a future solar project that includes 13 MW of batteries allowing solar output to be shifted to later in the day.
Demand side management — Current demand response programs are included in the Energy Wise program discussed above.
Inter-regional exchange — While inter-island cables have been discussed for some of the Hawaiian Islands (most notably Oahu and Maui), Kauai’s smaller size and location make it less likely to be able to share integration efforts with other islands, at least in the near-term.
Flexible resources — KIUC recently added a 7 MW baseload biomass power plant. This is meaningful because it frees up fossil fuel generation that used to be baseload to now be used as load-following resources. Existing diesel gensets have been upgraded to provide more flexibility including the ability to run below 50% loading and to ramp quickly.
In addition to the efforts described above, KIUC has made changes to its generation interconnection requirements and its distribution grid. These include inverter requirements, installation of advanced metering, and redesign of relay protection and load shed schemes.
As of early 2016, KIUC feels confident in its ability to reliably and economically achieve over 50% renewables by 2023. The next question will be how to squeeze out the last 35% of fossil fuel generation. This will likely require advancements in biofuels and electric storage, which is a topic worthy of its own discussion in a future post.
Footnotes:
[1] For a scenic view of many of KIUC’s renewable generation, watch the short video at: https://vimeo.com/153464892
[2] Lazar, J. (2016). Teaching the “Duck” to Fly, Second Edition, Montpelier, VT: The Regulatory Assistance Project. Available at: http://www.raponline.org/document/download/id/7956
[3] For more details, see the KIUC website at http://kiuc.coopwebbuilder2.com/content/about-us and the Case Study Kauai Island Utility Cooperative: The Impact of Extensive PV Penetration, Tom Lovas, July 2015 at http://www.nreca.coop/wp-content/uploads/2014/09/ts_kiuc_pv_case_study_july_2015.pdf


 Source: NERC 2015 Long-Term Reliability Assessment, p. 20
 Source: NREL.gov[1]
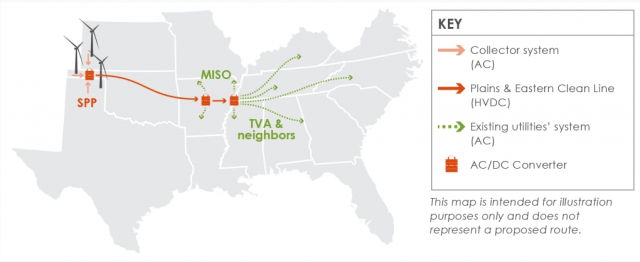 Source: Cleanlineenergy.com
 by
by 


 exporting liquefied natural gas (
 while 2.2 Bcf/d of new export capacity was added to the market.[
 shifting. But for U.S. gas production there is a new factor: global price exposure due to U.S.