What Services Can Distributed Energy Resources (DER) Provide to the Grid? Part II

by Bob Shively, Enerdynamics President and Lead Facilitator

Our last blog post discussed the transformation from an electric grid driven by centralized generation to a grid powered by distributed energy resources (DER). For this transformation to successfully occur, industry insiders must understand the many services that DER must provide if and when it becomes a primary energy resource. 

DER services tableAs shown in the table above, these services can be divided into energy-related services and network-related services. Last week we looked at what each energy-related service entails. We continue this week by outlining each network-related service.

Network-related Services

  • Voltage control: In addition to providing real power (kW) to match consumer loads, electrical systems must provide reactive power (vars) to match the consumption of reactive power by electrical lines and by certain types of loads (electric motors, fluorescent lights for instance). Reactive power historically has been provided by central generators and/or by devices on the distribution system such as capacitor banks. Voltage control is the ability to provide vars to the system as needed.  
  • System support during disturbances: A disturbance on a distribution circuit often results in voltage dips below normal levels. These dips may be temporary in nature. DERs are often set to isolate themselves from the grid when low voltage occurs. But this makes the problem worse as sources of supply are removed from the system. DERs designed to ride through low voltage can provide a benefit of helping keep the system voltage from dropping to the point that the circuit automatically takes itself out of service and causing a blackout.
  • Power quality: Distribution utilities strive to deliver electricity with high power quality meaning that voltages and currents follow a consistent pattern. But various consumer devices can result in localized impacts on the power on a specific distribution circuit, including variation in voltage magnitudes, voltage dips and spikes, or variations in wave shapes. DER can be beneficial or harmful to power quality depending on the design of DER inverters and on operational practices.
  • Energy loss reduction: Power that is delivered from a generator to a load results in losses along the transmission and distribution system. Energy loss reduction is production of energy at or near the consumer that provides a reduction in system losses. 
  • Mitigation of constraints: The lowest cost source of supply cannot always be used due to lack of transmission capacity to deliver the supply to loads. Production of energy at or near the consumer can provide resources that can be used to mitigate constraints on the transmission system.
  • New T&D capacity deferral: Growth of loads can result in the need to upgrade transmission and distribution facilities.  These upgrades can sometimes be costly.  Production of energy at or near the consumer can provide supply that does not require T&D capacity for delivery to the consumer. If located in the right spot, DERs can be used as an asset to avoid or delay having invest in system upgrades.

Attracting these services from DER will require significant changes to current regulatory and business arrangements; both the utilities that operate the networks and the owners of DER must be incented to take advantage of the services that distributed resources can provide, and owners must be paid appropriately for the benefits that DER assets bring to the system. We will explore these issues in future articles.

Posted in Electricity, Renewables | Tagged , , | Leave a comment

What Services Can Distributed Energy Resources (DER) Provide to the Grid?

by Bob Shively, Enerdynamics President and Lead FacilitatorRooftop Solar Panels on Factory Roof

Some key regions around the world – New York, California, and Germany among others – are amidst a major transformation from an electric grid driven by centralized generation to a grid powered by distributed energy resources (DER). New York is currently revising its method of regulating electric utilities to foster use of DER when they are more economic than traditional generation resources. As Audrey Zibelman, Chair of the New York Public Services Commission, wrote recently in IEEE Power and Energy Magazine:

“It is time to recognize that the demand side of the grid can be a more-valuable resource than we could have imagined 30 years ago. Rooftop solar, energy storage (from household batteries to electric vehicles), smart energy management technology, and the aggregation of demand are all areas where demand, rather than generation, can become the state’s primary energy resource.”[1]

As this transformation is occurring, it is important for those in the energy industry to understand the services that DER must provide if they are to become a primary energy resource. It takes much more than just kilowatt-hours to run a grid reliably. As shown in the table below, necessary services can be divided into energy-related services and network-related services[2].

DER services table

Below is a closer look at energy-related services and what they entail. Next week we’ll continue with a deeper look at network-related services.

Energy-related Services

  • Energy (kWh): Load-serving entities (LSEs) must ensure that sufficient kilowatt-hours (kWh) of supply are provided to the grid to match their customers’ loads plus system losses. Energy acquired by LSEs may be purchased forward (for a period in the future beyond tomorrow), day-ahead (for delivery tomorrow), hour-ahead (for delivery in the next operating hour), or in real-time (for immediate delivery). Depending on the type of DER, energy can be made contractually available for some or all of these timeframes. 
  • Firm capacity (kW): System operators must ensure that enough supply capacity is available to provide energy upon request during future timeframes. Capacity planning occurs over long-term periods (three or more years) as well as seasonally and monthly, and capacity is planned to meet the forecast peak demand during that time period plus a reserve margin. DER that can reliably provide energy during the peak can provide capacity services.
  • Fast ramp capacity (kW): In regions with significant variable renewable resources (wind and solar) system operators must ensure capacity to provide kWh upon request during a specified period with the capability to move from one level of output to another level of output quickly (measured in kW or MW per minute). DER with the capability of ramping quickly can provide fast ramp capacity.
  • Operating reserves: Going in to each operating hour, the system operator must have available sufficient capacity to provide kWh as needed to balance the system during an operating hour. This reserve capacity is needed to respond to both normal supply and demand fluctuations and fluctuations due to contingencies such as unexpected loss of generation or transmission.  Various operating reserves are required including regulating reserves, spinning reserves, non-spinning reserves, and supplemental reserves. Certain DERs can provide some or all of these services.
  • Black start: System operators must have availability of units that can start-up to put energy on the grid without first drawing power from the grid.  This is necessary to recover from grid outages. Certain DERs can provide this service.

Next week we’ll continue with a breakdown of network-related services.


Footnotes:

[1] Audrey Zibelman, REVing Up the Energy Vision in New York, IEEE Power and Energy, Volume 14, Number 3, May/June 2016

[2] This table has been adapted from figure 3 in the article by Ignacio J. Pérez-Arriaga, The Transmission of the Future, IEEE Power and Energy, Volume 14, Number 4, July/August 2016. 

Posted in Electricity, Renewables | Tagged , , | 1 Comment

Halting Fugitive Methane Emissions Is Key to Attaining Natural Gas’ Environmental Benefits

by Bob Shively, Enerdynamics President and Lead Instructor

Natural gas has recently replaced coal-fired generation as the dominant form of generation in the U.S. From the standpoint of power plant emissions of greenhouse gases (GHG) this is good news. On average, gas-fired generation emits less than 50% of the amount of GHG emitted by the equivalent output of coal generation.

history of generation

In fact, GHG emissions from the power sector in the U.S. declined by 13% in the decade ending 2014. Once data becomes available for 2015 the decline will be even more dramatic given the ongoing switch to gas generation.

emissions graph.jpg

But, there is a catch to this seemingly good news.  Uncombusted methane (methane typically makes up over 90% of natural gas carried in a pipeline) is a much more potent GHG than the carbon dioxide released when natural gas combusts. 

formula.combustion

The U.S. Environmental Protection Agency (EPA) has determined that methane has a Global Warming Potential (GWP) that is 28 to 36 times greater than the equivalent amount of carbon dioxide. Given that, even though much less methane is released, it still made up 11% of the U.S. human-caused GHG release in 2014[1].  This means that natural gas that is released during production or during its journey through the gas system prior to its combustion at the power plant is negating some of the benefits of converting coal to gas generation.   

Methane losses through the gas delivery system are called fugitive emissions. According to the Environmental Defense Fund (EDF) recent data suggests fugitive emissions are significantly higher than previously thought. In fact, EDF states that 2013 fugitive gas emissions have over a 20-year period “the same climate impact as over 200 coal-fired power plants”[2].

As EDF points out, “the lost gas is worth $1.4 billion at 2015 prices,” meaning that gas producers and pipeline companies have an interest in solving the problem that goes beyond being good environmental citizens. The good news is that fugitive emissions are a solvable problem once the source of emissions can be identified. 

A couple of years ago, an environmental scientist told me about his work in a gas field in Wyoming where he and his colleagues could not understand a new high concentration of methane that their instruments were measuring. Then one evening, he fell into conversation with someone who worked at a gathering pipeline company who told him that they had recently changed their procedures resulting in frequent purposeful blow-out of their pipelines. (For those not familiar with the term, blow-out means releasing gas into the air in order to clear the line for maintenance or other planned procedures.) His rapid calculations showed that the unexplained source of methane was now explained and could be addressed through new pipeline operating procedures.

methane map                   
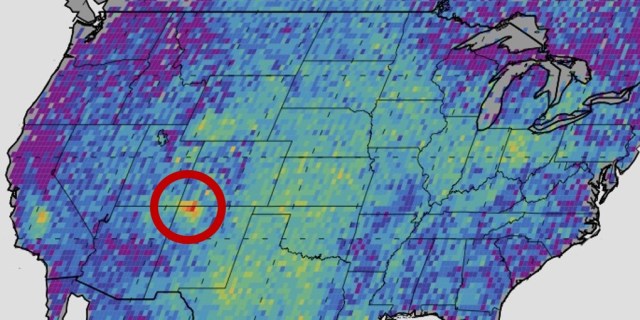
Source: NASA/JPL-Caltech/University of Michigan

Since then, scientists from various organizations have become active in identifying unexpected concentrations of methane and then identifying their causes. The photo above shows a concentration of methane in the Four Corners areas of Colorado and New Mexico (see the red/orange on the map) that is reportedly the size of Delaware. Researchers from NASA’s Jet Propulsion Laboratory and the California Institute of Technology spent the last two years identifying the sources of the methane by using low-flying aircraft with spectrometers. They recently published their findings in the Proceedings of the National Academy of Sciences. The research team discovered 250 sources of methane in the region ranging from gas wells, storage tanks, pipelines, and processing plant. 

But interestingly, two-thirds of the emissions came from only 25 sources. Asset operators in the region have already taken action. The result is that gas companies increase production and emissions are reduced. So it’s now feasible to find fugitive emissions and, in many cases, fix them through relatively minor actions. A key outstanding question is whether the industry will do so voluntarily or whether government regulations are required.


Footnotes:

[1] See EPA, Overview of Greenhouse Gases, https://www.epa.gov/ghgemissions/overview-greenhouse-gases

[2] See EDF, David Lyon, EPA Draft Says Oil & Gas Methane Emissions Are 27 Percent Higher than Earlier Estimates, http://blogs.edf.org/energyexchange/2016/02/23/epa-draft-says-oil-gas-methane-emissions-are-twenty-seven-percent-higher-than-earlier-estimates/


Posted in Natural Gas | Tagged , , | Leave a comment

What Does the Future Utility Look Like?

by Bob Shively, Enerdynamics President and Lead Facilitator

When I was growing up in the 1960s and 70s, phone service meant one thing – the service delivered by my local Bell company through copper lines connected to my house. Ask any millennial what a Bell company is and they will probably look at you with a blank face. Arguably, kids born today will have the same look when their millennial parents talk to them about the electric and gas utility company.

With the growth of distributed energy resources such as rooftop solar, demand side management, and customer-owned storage; the potential growth of a substantial new load in electric vehicles; and third parties such as Apple, Google, and Tesla tinkering with ideas of offering customer-oriented energy services, new business and regulatory paradigms likely will arise. The old business models that have worked for the last 100 years likely will not be sufficient to maintain success in the future, and utilities that survive will be radically transformed. Here is a graphic that we use in some of our seminars to describe potential futures for utilities:

case study 1

In times full of change, it is wise to consider multiple sources when formulating ideas on what the future might look like. Below we have gathered some good discussion from eminent industry thinkers. By reading these, you can start formulating your thoughts on what the future may look like for energy services.

In reading these various perspectives, some key trends emerge. Future customers will expect very different services from what they get today, technologies will radically change the nature of electric generation and delivery, new players will be offering energy services directly to consumers, and entities that deliver services will make money in a different way from today’s cost-of-service utilities. We will continue exploring these trends in future blogs and in various Enerdynamics’ seminars.


Posted in Electricity, Natural Gas, Renewables | Tagged , , , | Leave a comment

Mexico Natural Gas 2016: The 1990s All Over Again?

by Bob Shively, Enerdynamics President and Lead Facilitator

Giant Mexican national flag

For  U.S. and Canadian natural gas markets, the 1990s were a fun time. Gas demand grew as independent power producers (IPPs) and utilities built new combined-cycle gas-fired generation and industrial customers took advantage of new lower-cost gas supplies. Regulators forced the break-up of vertical integration driven by long-term contracts between producers, pipelines, and utilities.

Opportunities for marketers blossomed as pipelines were forced to become open-access transport providers, and large customers bypassed their local distribution companies to purchase supply directly from the market. Pipelines also benefited as new customers were willing to commit to firm capacity to access supplies, leading to a boom in construction of pipeline projects. 

Fast-forward 20 years: Today, Mexico is embarking on a similar path that promises to bring robust opportunities brought by growing demand, implementation of open-access pipeline rules, pipeline expansion projects, and opportunities for gas marketers. 

In 2013, we wrote in a blog post that while Mexico may be a long-term large gas producer, it is was in the short-term on its way to being a robust export market for U.S. gas supply.  This still holds true today, and the Mexican government and key gas users are taking critical steps to make market opportunities rapidly expand.

Natural Gas Supply and Demand


Mexico gas demand and prod

Demand for natural gas in Mexico has grown substantially in recent years driven by increasing use in industry and petroleum refining coupled with significant construction of new gas-fired electric generation. Growth is expected to continue throughout the next decade as shown in the following graph of demand projections from the Mexican energy ministry, SENER.


SENER projection
       Source: http://www.eia.gov/todayinenergy/detail.cfm?id=16471

Much of the growth will be driven by the ongoing switch from oil to gas-fired generation with over 20 GW of new gas generation expected to be built by IPPs and the state-run electric utility CFE over the next five years[1].

While demand has grown, domestic gas production has declined as producers have focused more on oil production. Oddly for a country with the plentiful gas resources of Mexico, the result has been a need to increase imports both from U.S. pipelines as well as from LNG.

Mexico NG imports
Use of imported gas is expected to continue to grow, driven by increasing imports from the U.S.

SENER projection imports


Pipeline Infrastructure

Historically, pipelines in Mexico were owned and operated by the national oil company PEMEX.  The natural gas transport system was designed to serve southern loads from Mexican production in the Gulf of Mexico and northern loads via import pipelines from the U.S.  LNG import capability was added in the late 2000s to supplement existing sources of supply on the southern system and to create new supply in northern Baja California. In recent years construction of additional import pipelines from the U.S. has exploded with import capacity doubling. Additional construction will continue as shown on the SENER graph above.

Enerdynamics Mexico Map

Market Restructuring and the Future

Perhaps the best news for interested market participants is that Mexico is rapidly implementing restructuring to open the markets to multiple parties. PEMEX’s monopoly on gas pipelines and sales has been ended by government fiat. The federal gas regulator, Comisión Reguladora de Energía (CRE), has been tasked with overseeing a transparent, impartial gas market. Rather than transferring ownership of the existing PEMEX pipelines, an independent gas system operator known as Centro Nacional de Control del Gas Natural (Cenegas) has been created to manage unbiased open access to pipeline capacity allowing use by gas marketers and even large end users. 

Meanwhile, third parties are now allowed to build new pipelines. The electric utility CFE has been very active contracting for new pipelines. But often, all the space in new lines will not be used by CFE, thus opening capacity for other parties as well. Mexico hopes the result will be growth of a vibrant gas market with multiple participants entering the market. Given these expectations, there is talk of creating one or more price points within Mexico such as Monterrey or Reynosa (currently much of the gas in Mexico is priced as a basis to U.S. indices such as the Houston Ship Channel).

Given these developments, it appears Mexico is poised to enter a common competitive gas market with the U.S. and Canada. And there is even talk in the future of expanding pipelines into Central America to create a true uniform North American gas market. But of course, “the proof will be in the pudding” as they say, and we will eagerly watch to see how market developments play out.


Footnotes:

[1] Platts, Mexican Gas Market available at http://www.platts.com/IM.Platts.Content/Downloads/PDFs/mexican-gas-market.pdf


Posted in Natural Gas | Tagged , , | 1 Comment

Amazon’s Echo Speaker: Your New Home Energy Management System?

by Bob Shively, Enerdynamics President and Lead Facilitator

In July of last year, we featured a blog post titled The Home of the Future, A Profit Center for Residents? It explored a future home in which a home energy management system (HEMS) connected to various home devices might automatically interact with electricity markets to lower energy costs or even turn the home into an energy profit center. At the end of the article we noted two developments necessary to further the home of the future: changes to the electric utility business model and growth of innovative service providers.

While utilities and regulators in a few jurisdictions are considering alternate business models and developing services, potential technology service providers are moving rapidly to create products that will attract consumers now. 

In our infographic of the future home, the resident is looking intently at a “home energy app” on her tablet. Thanks to innovation introduced to the market by Amazon’s Echo, I now think we made a mistake when designing this graphic. Rather than showing the resident looking at a tablet, we should have simply shown her speaking. Amazon’s Alexa personal assistant, accessed through the home Echo speaker, can already perform voice-activated functions such as adjusting thermostats and lighting levels, controlling switches, and querying security systems to see whether a window is open.

By providing open source code to software developers, Amazon claims that Alexa has thousands of “skills” to help in the home.[1] Home automation developers already include WeMo, Philips Hue, Samsung SmartThings, Wink, Insteon, Nest, and ecobee smart home devices.[2]

Whether it is Amazon or some other provider like Google or Apple, you may already have an early version of your future HEMS in your house. According to recent survey by icontrol Networks[3], key reasons for consumers to invest in smart home technology include security, energy cost savings, convenience, environmental benefits, and home entertainment.

Amazon has made it easy to get started because consumers can dip their toes in the water by simply buying a $180 speaker — and then can incrementally add more and more services as they wish. 

Utilities are beginning to notice the rapid technology development and may soon join in. One of the more forward utilities, Vermont-based Green Mountain Power, is offering a service called eHome. According to Green Mountain:

“eHome includes a home energy makeover that can include a heat pump hot water heater, heat pumps for heating and cooling, weatherization and LED lighting. It also includes innovative home automation controls to see energy use in real time and allow for control of thermostats, outlets, lights and heat pumps.”[4] 

With major technology companies such as Amazon and Google already fighting for your business[5] and utilities beginning to take notice, the “home of the future” may be available sooner than later.


Footnotes:

[1] See https://www.amazon.com/Amazon-Echo-Bluetooth-Speaker-with-WiFi-Alexa/dp/B00X4WHP5E

[2] See http://www.wired.com/2016/06/ amazon-echos-head-start- biggest-advantage/?mbid=nl_62416_p2 

[3] 2015 State of the Smart Home Report, https://www.icontrol.com/blog/2015-state-of-the-smart-home-report/

[4] See http://www.greenmountainpower.com/innovative/ehome/

[5] See Google Home vs. Amazon Echo, http://www.cnet.com/news/google-home-vs-amazon-echo/


Posted in Electricity | Tagged , , | Leave a comment

Gas Pipeline Safety Regulations Continue to be Strengthened

by Bob Shively, Enerdynamics President and Lead Instructor

“Safety is cited as the No. 1 concern among all sectors of the natural gas industry”[1]

gasexplosion_000

As we have often discussed in Energy Currents blog posts over the last two years, safety of natural gas pipelines and storage fields has become a critical issue for the industry. Significant recent incidents have exposed the risks associated with aging infrastructure and traditional operating procedures.

In response to congressional mandates and various industry safety recommendations, the federal agency responsible for regulating pipeline safety (the U.S. Department of Transportation’s Pipeline and Hazardous Materials Safety Administration, commonly called PHMSA) recently proposed a new natural gas transmission rule.

The proposed new rule changes would extend to additional parts of the pipeline system and would expand rules associated with parts covered in existing rules. Changes include:

  • Extending rules to many gas gathering pipelines and to newly defined Moderate Concentration Areas (MCAs)
  • Applying pressure testing and maximum allowable operating pressure or MAOP verification to pre-1970 pipelines
  • Modifying pipeline repair criteria
  • Providing additional direction on evaluation of internal inspection results
  • Clarifying requirements for conduction risk assessments, including addressing seismic risk
  • Expanding mandatory data collection and integration requirements
  • Requiring additional post-construction quality inspections
  • Requiring new safety features for pipeline launchers and receivers used in internal pipeline inspections
  • Requiring a systematic approach to verifying MAOP and requiring operators to report when a pipe’s MAOP has been exceeded

The proposed new rules are out for public comment as I write this post and are expected to be implemented quickly. The result will be increasing time and money spent on pipeline safety but hopefully a corresponding reduction in pipeline incidents.

For more discussion on pipeline safety, see the following resources:

For a detailed discussion on principles associated with gas pipeline safety, read the full version of this article that recently appeared in our Q2 2016 edition of Energy Insider.


Footnote:

[1] “Pipeline Safety: Top Concern for All Segments of Natural Gas Industry,” Christina McKenna, Enerdynamics Energy Currents Blog, November 6, 2014

Posted in Natural Gas | Tagged , , , | Leave a comment

Electric Vehicles May Be Key to Utilities’ Load Growth

by Bob Shively, Enerdynamics President and Lead Instructor

Just over a year ago, penetration of electric vehicles was miniscule compared to the more EV Norway w credit
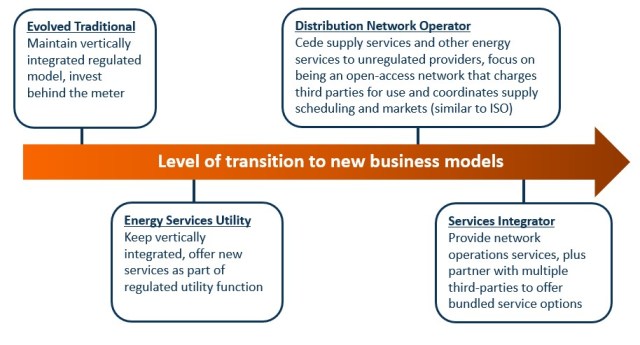
than 226 million registered vehicles in the U.S. But, as we noted in our Q1 2015 issue of Energy Insider, change was happening through various initiatives by car manufacturers, electric utilities, and new integrated solutions that combine smart homes and EVs. Given the speed at which technology can develop and the significant impacts that EVs could have on our industry, it’s worth looking at developments in EV growth in the last year.

Ownership of EVs, including Plug-in Hybrids (PHEVs), has continued its growth. The U.S. still leads the world in number of EVs, though not in percentage of cars that are EVs, where Norway with over 25% holds the lead.

EV growth v2

numberofevsasof4-16_001

     source: hybridcars.com

Key factors preventing more sales in the U.S. include the price tag and the specter of running out of charge due to low range. EV manufacturers have been working on these issues and, in 2016, numerous announcements have been made about coming models with over 100 miles of range at a price less than $40,000.

EVs range and price.png

    source: hybridcars.com

Some manufacturers also have continued their efforts to package EVs with other green home innovations. Ford continues its work on MyEnergiLifestyleTM (although it’s currently focused on the Chinese market[1]), and Tesla recently offered to buy SolarCity to create a “highly-integrated, sustainable energy company.”[2]

A recent paper by the Rocky Mountain Institute titled Electric Vehicles as a Distributed Energy Resource[3] suggests that if utilities take a proactive approach to EV implementation – an approach focused on properly-sited charging stations and rate design price signals – the result will be significant benefits for ratepayers and shareholders. Utilities must develop rates or incentives that place charging stations at optimal locations on the grid and encourage charging during low-cost hours when system supply is high relative to demand. In some regions this may become mid-day with large amounts of solar power flooding the grid; in others it may be at night when wind power or unneeded traditional baseload generation is available.  

Believing projections about major technology shifts is dangerous business, but at least one respected organization, Bloomberg New Energy Finance, has projected that by 2022 EVs will cost the same as gasoline-powered cars[4]. If so, utilities that develop forward-thinking EV offerings now may soon benefit from a new source of load that will rekindle the past days of robust load growth.


Footnotes:

[1] Ford partners with Trina Solar to launch myenergi-lifestyle in China, Vincent Shaw, pv magazine, May 29, 2015, http://www.pv-magazine.com/news/details/beitrag/ford-partners-with-trina-solar-to-launch-myenergi-lifestyle-in-china_100019621/#axzz4CXcXOYt5

[2] Solar plus storage: With SolarCity deal, Tesla aims to speed clean energy transition, Gavin Bade, UtilityDive.com, June 22, 2016, http://www.utilitydive.com/news/solarcity-tesla-deal-/421370/

[3] See http://www.rmi.org/evs_as_ders

[4] Here’s How Electric Cars Will Cause the Next Oil Crisis, Tom Randall, Bloomberg.com, February 25, 2016, http://www.bloomberg.com/features/2016-ev-oil-crisis/


Posted in Electricity | Tagged , , , , | Leave a comment

Renewables Require System Operators and Designers to Rapidly Respond to Changing Load Curves

by Bob Shively, Enerdynamics President and Lead Instructor

“From the decline of coal power to the rise of energy storage, big changes are taking hold in the industry…changes are taking hold faster than many expected. The electric sector is no longer simply anticipating a revolution – depending on where you are, it is embroiled in one today”[1]

 Since the widespread advent of air conditioning in the U.S., the electric industry has had fairly predictable shapes to load curves. While system operators and T&D design engineers had uncertainty about year-to-year load growth, the shapes of the curves was predictable. Typical curves looked like the following for a large operating region:

summer load curve 2winter load curve 2

Predictable shapes allowed system operators to consistently plan for load variability given weather forecasts. Similar curve shapes applied to the specific load on many distribution circuits serving residential and commercial loads giving transmission and distribution engineers a predictable pattern of demand to design for.

But as penetrations of renewables increase, system operators and engineers must design for new criteria – loads minus renewable output. On the system level this tells operators how much traditional generation must be available and/or operating at any given point in the day. At the distribution circuit level, it tells engineers what power flows they must design the circuit to reliably carry. As you might imagine, net load curves are fundamentally changing. At the system level, the shape of the curve has changed to a curve that looks somewhat like the back of a duck, hence that is called the “duck curve”:

Duck curve

The above graph showing expected net loads in the California ISO (CAISO) systems demonstrates just how quickly things are changing. By 2020, mid-day net loads are expected to have dropped from 20,000 MW to 12,000 MW during high solar hours. 

When net loads are observed on specific circuits with high penetration of solar, results are even more dramatic. Here are net loads on a representative circuit in Hawaii:

average transformer load

Note that for certain high solar hours the circuit has negative net load, which means that power is back loading into the distribution substation and back into the transmission line. In other hours, the circuit has a net load greater than 5 MW. In Hawaii, with rapidly growing solar installations, this curve has been referred to as the Loch Ness Monster since loads “disappear under the water” and are not visible to the system.

In an earlier blog post, we explored how the island of Kauai is dealing with this issue. As the above load curves show, system operators and system engineers around the country will need to learn from areas like Hawaii and California that have high early penetrations of renewable energy and prepare themselves for load curve changes when significant amounts of renewables come to their systems. 


Footnotes:

[1] From “The Top 10 Trends Transforming the Electric Power Sector,” Utility Dive, September 17, 2015

Posted in Electricity, Renewables | 2 Comments

Economics, Not Policy Mandates, Drive the Growth of Renewables

by Bob Shively, Enerdynamics President and Lead Instructor

“For the windpower purchasing agreements we’re looking at about $2m a year [in] savings, averaged over the term of the contract.”
– Rob Threkhold, Global Manager for Renewable Energy at GM[1]

“When we’re buying wind at $25, it’s a hedge against natural gas.”
– Ben Fowke, CEO, Xcel Energy[2]

Renewable energy has become the fastest growing source of capacity and output in the crossword puzzle with green termsU.S. In the last decade renewables output has shown an average annual growth rate of 32%[3]. In 2015, 67 % of new capacity was made up of wind and solar[4].

Certainly some of this is driven by policy mandates including renewable portfolio standards. But more and more, growth of renewables is being driven purely by cost considerations. The result is that utilities and retail providers are buying renewable power simply because it is the low-cost source of supply, and many large corporations are contracting for long-term renewables supplies as a means of hedging against future increases in the cost of electricity.

 One way of measuring the cost of new supply sources is to look at the levelized cost. This methodology takes various factors including variable operating and maintenance costs, fixed operating and maintenance costs, forecasted fuel costs, capital costs and assumed capacity factors to determine the average overall $/MWh cost of generating electricity over the life of a source of generation. For this discussion, we will use an analysis by Lazard[5], which is updated annually. The numbers below show the estimated levelized cost for various technologies as of November 2015.

Unsubsidized midrange cost

Note: Costs do not include integration costs for variable resources (which Lazard suggests may cost an additional $2 to 10/MWh) nor carbon emissions costs, which depending on future regulatory and market developments, may range from $0 to 40/MWh for coal and $0 to $20/MWh for gas combined-cycle (many planners assume a future carbon cost in the range of $20/MWh for coal and $10/MWh for gas combined-cycle). Natural gas and coal generation is sensitive to future changes in fuel prices, and this analysis assumes a coal price of $2/MMBtu and a gas price of $3.50/MMBtu.

So we can see that even without subsidies, wind power comes in as the low-cost source of electricity. And utility-scale solar is in the ballpark of cost effectiveness with coal and nuclear but doesn’t have the environmental issues associated with coal and nuclear[6] nor the high capital requirements to build a nuclear plant. 

At the end of 2015, the U.S. Congress reauthorized Investment Tax Credits (ITC) for solar power and Production Tax Credits (PTC) for wind power[7]. Let’s take a look at what the levelized costs looks like with these in place:

Midrange cost w tax subsidies

Note: It should be noted that the assumptions used to generate these costs are not exactly synonymous with the final bill passed by Congress, but are close to what was approved.

Now it is entirely clear why utilities are increasingly choosing renewable power as a source of new capacity and why corporate energy buyers are choosing to enter into long-term purchase power agreements for renewables power. Even without renewable portfolios or a carbon price, such transactions simply make economic sense. Given the numbers, we can expect renewable power to continue its rapid growth rate, and all energy market participants must plan future strategies assuming that renewable power is here to stay.


Footnotes:

[1] U.S. Companies Spearhead Renewable Energy Drive, FT.com, May 12, 2016: http://www.ft.com/cms/s/0/e230d280-15e2-11e6-b197-a4af20d5575e.html#axzz4AvAxqg7Y

[2] Wind Power Now Cheaper then Natural Gas Xcel CEO Says, Bloomberg, October 23, 2015 http://www.bloomberg.com/news/articles/2015-10-23/wind-energy-cheaper-than-natural-gas-for-xcel-ceo-fowke-says

[3] See http://www.eia.gov/electricity/monthly/epm_table_grapher.cfm?t=epmt_1_1

[4] See http://www.eia.gov/todayinenergy/detail.cfm?id=25492

[5] Available at https://www.lazard.com/media/2390/lazards-levelized-cost-of-energy-analysis-90.pdf

[6] Nuclear is sometimes opposed by environmental groups for reasons associated with lack of a disposal site for long-lived nuclear waste and for the risks of radioactive releases. Other environmental groups support nuclear power since it provides zero carbon energy.

[7] See summary here: http://www.eia.gov/todayinenergy/detail.cfm?id=26492

Posted in Electricity, Renewables | Tagged , , , , | Leave a comment