Mexican Natural Gas – The Next Paradigm Buster?

by Bob Shively, Enerdynamics President and Lead Instructor

Back when I worked in Calgary in the early 1990s, a consultant’s study made the rounds mexico mapsuggesting that Canadian producers should be alert to a possible competitive threat from the south.  Specifically the report stated that theoretical natural gas reserves in Mexico were so robust that one day Mexico might supplant Canada as the preferred source of imported natural gas to the United States.

Twenty years later, Mexican imports of U.S. gas have grown by a factor of 10, pipeline companies are rushing to build new pipes from the U.S. into Mexico, and Mexico imports liquefied natural gas (LNG) from counties such as Qatar and Peru. Meanwhile Mexican industrial and power plant gas demand has more than doubled in the same timeframe.  Does this mean the consultants had it all wrong?  Maybe, but maybe they were just well before their time.  Recent discoveries of significant shale gas resources in northern Mexico, coupled with potential political and regulatory reforms being pushed by the newly elected President Enrique Peña Nieto, suggest the possibility of significant future growth in Mexican gas production.

US gas exports to Mexico

Mexico gas supply and demand

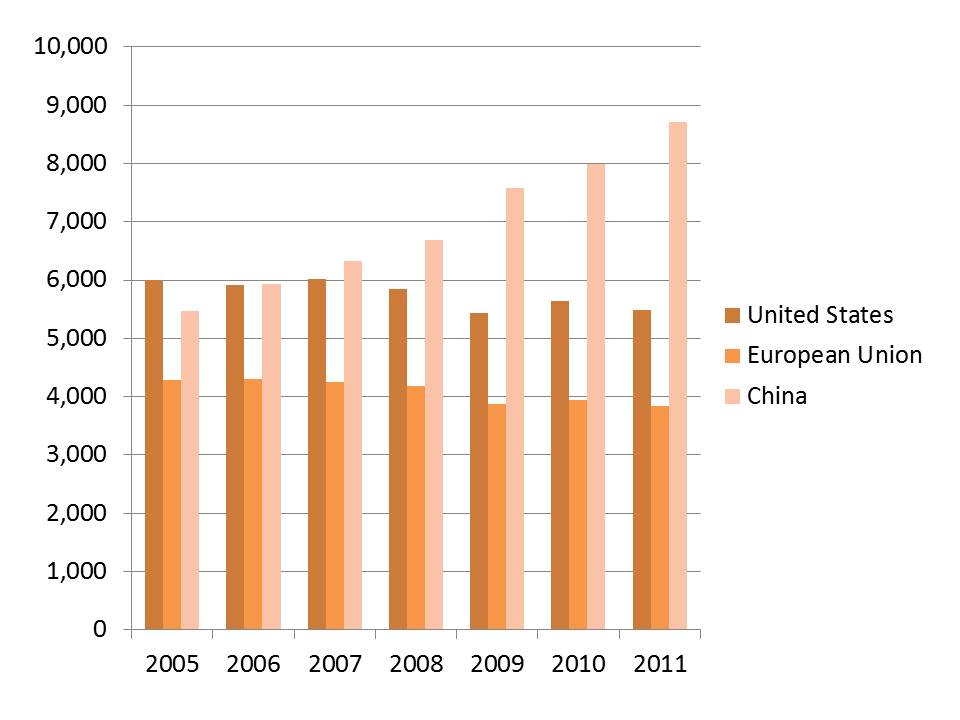
Source of above graphs:  U.S. Energy Information Administration March 13, 2013 Today in Energy [1]

Gas demand in Mexico is largely dominated by use by the national oil company PEMEX, which uses gas for refineries, petrochemical plants, and oil exploration and production.  This accounts for about 40% of demand.  Another 33% is used for electricity generation and the remainder is used mostly by non-PEMEX industrial customers.  Mexico used about 2.4 Bcf in 2011 and projections are that gas demand will continue to grow due to continued construction of gas fired power plants and growth in industrial output.   Gas demand has risen on average by 4% a year between 2007 and 2011. According to projections by the federal electric monopoly Comisión Federal de Electricidad (CFE), demand for gas could triple to over 7 Bcf by 2027 just due to power plant growth [2].

Meanwhile, gas production in Mexico has failed to keep up with growing demand despite robust reserves. In the time frame of 2007 to 2011, gas production grew by 1.2% per year while demand was growing by 4%. Beginning in the early 2000s, Mexico found it necessary to significantly grow imports to meet demand, including significant growth in net pipeline imports from the U.S. and construction of three LNG import terminals.

Mexico gas sources 2011

Mexico has about 17 Tcf of proven reserves.  Technologically feasible reserves of conventional natural gas greater than 60 Tcf [3].  Much recent study has gone into the potential for shale gas reserves.  An initial EIA assessment estimated 681 Tcf of technically recoverable shale gas, which is the fourth largest of any country studied by the EIA [4].  And much of this gas is located in regions near the U.S. border.

So could Mexico one day become significant importer of gas to the U.S., thus keeping U.S. gas prices lower?  Or will Mexico continue to become a growing source of export demand for U.S. gas causing U.S. prices to rise?

As with many things in the energy business, the future has a lot to do with politics.  Mexican gas production has historically been constrained by lack of capital and lack of attention.  Much of this has to do with nationalization of the Mexican gas and oil sector in 1938 with Petróleos Mexicanos (PEMEX) designated as the sole oil and gas operator in the country.  Provisions were added to the Mexican Constitution prohibiting foreign companies from owning oil and gas resources.

PEMEX is one of the largest oil producers in the world, but has tended to focus more on oil production than natural gas.  And the Constitutional provision has prevented other companies from investing in PEMEX’s stead.  The desire to prevent foreign companies from taking over Mexican resources has been strong, and historically there has been no political will to alter things.  But this may now be changing.  Reforms in 2008 allowed PEMEX to create incentive-based service contracts with foreign oil and gas companies that would allow these companies to participate in exploration and production (although foreigners still cannot own the resources).

In 2011 PEMEX awarded the first foreign production licenses for oil in more than 70 years and the same model can be used for gas exploration and production.  And in the Presidential election of 2012, Peña Nieto included more extensive energy reform as one of his campaign goals. As of mid-2013 he seems to be building a political coalition that might indeed pull off significant reforms.

So we can conclude that the gas appears to be there.  Whether the politics, economics and technological factors will align to make it happen remains to be seen.  But it appears much more likely than it did 20 years ago.

References:


[2] Data on demand and production is taken from various U.S. Energy Information Administration (EIA) sources unless otherwise noted

[4] World Shale Gas Resources: An Initial Assessment of 14 Regions Outside the United States, U.S. Energy Information Administration, available at http://www.eia.gov/analysis/studies/worldshalegas/pdf/fullreport.pdf

Posted in Uncategorized | Tagged , , , , , , , , , , | 2 Comments

Is the U.S. Ready for National Greenhouse Gas Regulation?

 by Bob Shively, Enerdynamics President and Lead Instructor

Flash back eight years ago to 2005.  U.S. greenhouse gas emissions (GHG) from energy consumption were increasing annually with emissions having grown by almost 20% since GHG1990. The Bush Administration announced in 2001 that the U.S. would not implement the Kyoto Protocol. Rather than pursuing regulatory mandates, the Administration announced support for voluntary measures and tax credits to encourage businesses to reduce GHG emissions[1].

Meanwhile in Europe, the European Union launched the European Union Emissions Trading Scheme (EU ETS), which regulated GHG emissions in 31 European countries through a cap-and-trade mechanism. Its goal was to reduce emissions by 21% by 2020.  And although emissions in China had grown significantly in recent years, China’s energy-related emissions were still almost 10% less than those in the U.S[2].

U.S. GHG Emissions from the Consumption of Energy 1990-2005
(in millions of metric tons)

GHG USSource: U.S. EIA International Statistics 

How different the world of GHG looks today.  By the end of 2011, the U.S. has reduced energy related GHG emissions by 8% since 2005. With the ongoing implementation of the EU ETS, the European Union had reduced GHG by 10%.  And China, with its rapidly expanding economy, had increased emissions by a whopping 59%.

GHG Emissions from the Consumption of Energy 2005-2011
(in millions of metric tons)

world GHG

As discussed in Enerdynamics’ recent Energy Insider[3], key factors contributing to the reduction in the U.S. include the economic downturn in 2008, growth of renewable generation, energy efficiency efforts, and perhaps most importantly a major shift from coal to natural gas-generated electricity.

Interestingly, as U.S. GHG emissions have declined in recent years, there is revived talk that the time may have come for national regulation of GHG emissions. Certainly we’ve been here before.  Legislative action has stalled numerous times, included the demise of the Waxman-Markey bill in the U.S. Senate in 2010 (despite having already passed the House and having the support of President Obama)[4].  But the U.S. Supreme Court in 2007 ruled that greenhouse gases fit within the definition of air pollution in the Clean Air Act, thus requiring the EPA to regulate GHG if the EPA determined that the gases endangered public health.  Subsequently the EPA ruled that GHG do endanger public health, and this determination was upheld by the U.S. D.C. District Court of Appeals in 2012.

The EPA has already issued proposed rules for new power plants[5], and many believe that the next logical step would be to extend rules to existing units.  The Wall Street Journal recently reported that the Edison Electric Institute, a utility trade group, may take a cooperative role in working to create national GHG regulations[6] based on a belief that legislative solutions could be more flexible than EPA rules.  And George Shultz and Gary Becker of the conservative Hoover Institution recently wrote a paper suggesting the time has come for a national revenue neutral carbon tax[7].

So does this mean that fear of EPA regulation will coalesce enough parties to get legislation passed?  In today’s fractured Washington politics, that is hard to predict.  But it is a renewed possibility.

References:


[1] See: Bush Unveils Voluntary Plan to Reduce Global Warming, http://archives.cnn.com/2002/ALLPOLITICS/02/14/bush.global.warming/index.html

[3] See U.S. Greenhouse Gas Emissions at 20-year Low —
What Happened?    http://marketing.enerdynamics.com/Energy-Insider/2012/Q3Electricity.html

[4] For an interesting discussion of how this bill failed to pass in the Senate, see the New Yorker article As the World Burns available at http://www.newyorker.com/reporting/2010/10/11/101011fa_fact_lizza?currentPage=1

[6] Wall Street Journal, Power Sector Plans for New Rules, April 24, 2013

Posted in Electricity, Natural Gas, Renewables | Tagged , , , , , , , | Leave a comment

Energy Companies Using ‘Executive Forums’ to Effectively Train Employees

By John Ferrare, Enerdynamics CEO

A new offering by Enerdynamics that’s really taken off this past year is the executive forum. We’ve done four of these in the past year, and each one has been tremendously successful. While not exclusive to executives, the idea is that, in contrast to the interactive seminars we usually present, the forum is a way to get a lot of information out to much larger groups of people than we could typically manage in a traditional seminar.

Here’s how this works: Typically a client will have a specific audience in mind and want to educate this audience on a very specific topic. The most recent forum we presented was for a major producer of wind turbine equipment. This group wanted to better understand how energy markets work, how renewables fit in energy markets, and how the role of renewables in markets around the world is evolving.

In this case (as in most), the client worked closely with our course development team to come up with an agenda that matched its very specific parameters. To do this, we began with content from a number of our existing seminars and then systematically honed this down to, in this case, a half-day presentation. The rest of the day was reserved for Q&A and other industry professionals.

Another example is a basic electric class that we presented to a law firm’s energy practice. While this particular forum relied heavily on existing content, we made sure to package it into clearly identified and stand-alone modules that were presented at specific times during the two-day event. As with any audience that bills time to clients, time is money. So this client wanted its attorneys to be able to select the topics that most interested them and attend only those. Again, the forum was highly successful and the client is asking for a follow-up event later in the year.

Another law firm was interested in the economics of the North American energy markets, specifically how shale gas is changing this dynamic. The client saw an opportunity in this area and needed to better understand how the markets were related and where they are likely headed. The result was a day-and-a-half forum that was well received by attendees and achieved all of the client’s goals.

While these forums are often combined with another company event, they need not be. They range in length from four hours to two days and have had audiences of up to 65. And surprisingly, even with a large group, interactivity can still be achieved. Companies find it is incredibly valuable to have their high-level employees all hear the same information on a focused topic and then have an opportunity to discuss and reflect on how this affects their business strategy.

If this sounds like an idea that could benefit your company, please contact me at jferrare@enerdynamics.com or 866-765-5432 ext. 700.

Posted in Energy Training | Tagged , , , , , , , , , | 1 Comment

Will Low Natural Gas Prices Stall the Shale Gas Boom?

by Christina Nagy-McKenna, Enerdynamics Instructor 

The U.S. natural gas market is on the verge of a decades-long growth period due to the robust development of shale gas. While optimism about U.S. gas supplies is not new – it has been a hot topic in the trade press for the past year – data regarding the dwindling number of natural gas rigs raises the question of how this expansion will continue as the actual number of new wells diminishes.

 Also, with natural gas prices below $4/MMBtu at the wellhead for a significant portion of this past winter, it makes sense to question if developers have sufficient economic incentive to continue drilling new wells and bringing more supplies on line. The decision hinges in large part on the developers’ cost of production as compared to market prices. However, getting to the true production price is not as straight forward as it may appear, and as such there is some disagreement as to what it will take for shale developers to be profitable.

New data concerning Barnett Shale seems to indicate that prices do not have to increase as much as previously thought in order for development of shale formations to continue.

A recently released study about Barnett Shale by the Bureau of Economic Geology (BEG) at the University of Texas [1] determined that 44 Tcf of natural gas, enough to meet almost two years of demand by the U.S. market, will be produced by the Barnett formation over its lifetime (approximated as 2050). BEG based this forecast on an average market price of $4/MMBtu for the gas, which, while somewhat greater than today’s $3.50/MMBtu, is a far cry from the higher prices natural gas producers grew to love in late 2000s.

The BEG study is the first to look at data from individual wells within the Barnett formation. Data from approximately 15,000 wells drilled in the past decade was examined well by well rather than averaging the production from all wells as other studies have done. BEG found that not all parts of the formation produce equal quantities of natural gas. Many wells were flops, and perhaps only half of the 8,000 square miles of the formation will actually yield an economical product for its developers.

Contributing to producers’ ability to make money at low natural gas prices are revenues from natural gas liquids (NGLs) and associated oil.  Wet gas, the liquid rich gas that contains oil and NGLs such as propane and butane, is worth more money due to the higher values associated with oil and NGLs. The Bakken Shale formation in North Dakota holds shale oil that contains shale gas as well. The average by-product of oil production is almost 1 million cubic feet of natural gas per barrel. Eagle Ford Shale in Texas has yielded 1.5 million cubic feet per barrel.[2]

Thus, producers in these regions can produce shale gas at a much lower net cost than those that are solely producing dry gas.  At this time, the gas in Bakken Shale is being flared as the infrastructure to capture and market the gas does not exist.  Plans are underway to change this as the State of North Dakota is working with developers to sort out land use issues that make the building of gathering facilities very complicated.

Read the full article that includes a discussion on falling gas rig counts and the relation to gas prices in our latest issue of Energy Insider.

References:

1. “New Rigorous Assessment of Shale Gas Reserves Forecasts Reliable Supply from Barnett Shale Through 2030,” The University of Texas at Austin web site, February 28, 2013.

2. February 2013:  Energy Strategies Report, Dr. Jim Gooding, Black & Vietch.

Posted in Natural Gas | Tagged , , , , , , | Leave a comment

The Value of Regional Transmission Organizations, Part II

By Matthew Rose, Enerdynamics Instructor

Last week we introduced this topic with Part I of this article and discussed the current landscape of the RTO and RTO development. This week we continue our examination of map and the shadow of Electric PlugRTOs with a discussion on the value and perceived benefits of RTOs as well as the issues and objections voiced by some stakeholders.

RTO benefits
There is no shortage of industry discussion regarding the qualitative benefits of a regional transmission organization. Many of the ongoing regulatory proceedings and rulings generally include discussion of the rationale and benefits for RTO-based organizations to handle the wholesale bulk power market. A listing of some of the key benefits follows:

What RTOs Do Implications
Provide independent transmission system access Equal and non-discriminatory transmission system access using transparent and open access transmission tariffs (OATT)
Perform efficient market operations Operate energy, capacity, and ancillary service markets using low-cost unit commitment, dispatch, and congestion management
Facilitate larger, competitive, and “liquid” markets   RTO rules encourage greater market participation, greater liquidity, and pricing options for participants
Coordinate regional planning Integrated system planning with regional expansion needs and plans; includes recent ruling FERC 1000
Deliver improved reliability Ensure reliability through efficient resource sharing and formalizing rules for handling “seams” issues
Ensure market competitiveness  Employ a “market monitor” to assess market competitiveness and ensure no market power or members with undue influence
Foster alternative resource options Facilitate markets for demand response and integrate renewable resources in the resource mix
Integrate risk management tools Provide hedging products including financial transmission rights to mitigate congestion risks

In addition to the above qualitative benefits, there have been recent efforts to quantify the extent of RTO benefits. In this process, the various RTOs have identified a series of value drivers and developed estimates of the economic value each provides to the RTO.

For example, the PJM Interconnect claims that its services provide regional savings benefits of more than $2 billion annually including savings from energy production cost from $340-$445 million annually.[1]  The Midwest ISO claims similar total annual economic benefits including an estimated $180-$200 million annually for its centralized dispatch of energy operations.[2] The Southwest Power Pool estimates that its move to a Day 2 market (locational marginal price as well as day-ahead and real-time spot markets) may result in annual net benefits of $100 million.[3]

As a point of detail, a more comprehensive forecast of benefits by value driver for the Midwest ISO is shown below:

Midwest ISO Value Proposition [4]  
Value Driver Estimated Annual Economic Benefit (in $ millions)
Reliability $180-$270
Dispatch of Energy $180-$200
Regulation/Spinning Reserve $130-$150
Wind Integration $240-$285
Compliance $60-$95
Footprint Diversity $760-$950
Generator Availability $455-$570
Demand Response $110-$145
MISO Cost Structure -($225)
Total Net Benefits  $1,890-$2,440
Note: economic benefits are rounded up based on MISO values

To the extent that these economic benefits are real it requires greater attention to the detail behind the valuation. For example, what methodology was used to arrive at the comparative costs to determine savings?  With this in mind, the FERC completed a Report to Congress aimed at examining the formal benefits of RTOs through a series of standardized metrics.[5] This effort was advanced by the United States Government Accountability Office.[6] The RTO metrics were designed to measure performance on three dimensions:

  • market benefits
  • organizational effectiveness
  • reliability

A comprehensive review of these metrics is outside the scope of this discussion (but will likely be addressed in a future Energy Insider issue). What is important is the recognition that the FERC Report identified 57 different metrics that it believes should be evaluated on an ongoing basis. This amplifies the recognition that determination of RTO benefits is wide ranging and includes numerous factors.

RTO objections
In discussing the economic benefits of RTOs, it is only fair to talk about the range of stakeholders who continue to voice objections to the RTO structure. The American Public Power Association (APPA) has maintained that RTO-run electricity markets fail to produce just and reasonable electric rates.[7] Some of their key objections include:

  • Offers to sell power are not directly connected to the sellers’ cost of production. The construct where the final bid establishes the price paid to all sellers needs to be analyzed as a means of ensuring lowest supply costs.
  • The current bidding structure and reliance on locational marginal pricing shows no evidence between locational price signals and the construction of new generation or transmission facilities.
  • Consumers are paying millions in additional charges required by RTO-run locational capacity markets, especially given the corresponding lack of market response to build new capacity in high-cost areas.
  • Limited options exist for long-term bilateral contracts due to the influence of high-price sellers and the growth of financial deals (versus physical transactions).

Moving forward, the APPA has suggested placing a FERC moratorium on the establishment of new RTO markets and encourages a formal cost effectiveness investigation into the impacts of RTO-run organizations.  (A review of the accompanying references used in this discussion includes numerous examples of objections to the current RTO structure.)

Conclusion
In the end, it is clear that most stakeholders see the benefits of moving to a RTO-based transmission organization. The efforts, resources, and dollars invested in the current RTO system make it difficult to consider reverting to another framework without significant policy backtracking. Still, there are areas where further efficiencies and market design considerations should and may be pursued. The goal now is to to build upon the efficiencies and grid access in RTO-based regions while widening the participation in devising methods to more accurately measure value and benefits.


References

1. PJM, PJM Efficiencies Offer Regional Savings ( taken from PJM website- PJM Value Proposition)

2. MISO, 2011 Value Proposition, January 2012 (presentation on MISO website)

3. SPP press release, SPP Files Tariff Revisions for Integrated Marketplace,  February 2012.

4. MISO, 2011 Value Proposition, January 2012 (presentation on MISO website)

5. FERC, Performance Metrics for Independent System Operators and Regional Transmission Organizations, April 2011.

6. Electricity Restructuring: FERC Could Take Additional Steps to Analyze Regional Transmission Organizations Benefits and Performance. GAO-08-987, September 2008.

7. Caplan and Brobeck, Have Restructured Wholesale Electricity Markets Benefitted Consumers, Electricity Policy.com, December 2012.

Posted in Electricity | Tagged , , , , , , , , , , , , | Leave a comment

The Value of Regional Transmission Organizations, Part I

By Matthew Rose, Enerdynamics Instructor

Decisions made by regulators more than a decade ago formalized a shift to organized wholesale transmission organizations for much of the United States. As electric deregulation advanced in various states in the 1990s, federal regulators saw a need to encourage an independent structure to facilitate the planning and operation of wholesale market operations. This included the need to ensure non-discriminatory access to the transmission system especially as operations crossed state boundaries and covered large regional areas. The reliance on Regional Transmission Organizations (RTOs) and Independent System Operators (ISOs) has provided a workable platform for much of the U.S.[1]

This move also has resulted in a wide-ranging set of new rules and markets as well as a shift in how revenues and payments are handled and distributed.  It is fair to say that this transition to RTOs has had its share of debates, issues, and even the occasional need for judicial oversight. This article examines the current landscape of the RTO and RTO development. Next week we will follow with Part II and discusses the value and perceived benefits of RTOs and explore the issues and objections voiced by some stakeholders.

Current landscape of RTOs
To truly grasp the benefits and value provided by RTOs, it is important to first understand the current landscape of RTO-operated markets. Most notably, the reliance on RTOs has not been fully standardized across the country. Despite Federal Energy Regulatory Commission (FERC) encouragement (and even a failed move to a standard market design) there are large geographic areas of the country with no organized wholesale market operation. This includes not only some investor-owned utilities but also the public power and electric cooperative operations. Still, RTOs cover about two-thirds of the nation’s electricity customers.

The development of RTOs, however, continues to emerge over time. With the input of regulators and stakeholders, the rules and markets are constantly being refined and modified. For example, the design of markets to facilitate demand response opportunities was not envisioned at the outset of the transition to RTOs, but now this design is a vital piece of the value stream across all the RTOs.

There are also differences in the market design details across the RTOs. These differences reflect varied market composition, maturity of the RTO operations, capacity availability, and unique elements of the respective markets. For example, there are certain market programs such as encouraging energy efficiency as a resource in the forward capacity market that are currently offered by a couple of RTOs.

Membership within the various RTOs also is growing. For example, Entergy Utilities recently submitted an executed transmission owner’s agreement with the Midwest ISO. Entergy claims that joining the MISO will save the organization $1.4 billion in the first decade of membership.[2] East Kentucky Power Cooperative (and its 16 distribution utility owners) also announced it will join the PJM Interconnect pending FERC and Rural Utilities Services approvals.[3] These considerations all point to a working structure that offers its members value and benefit to continue ongoing growth and direction of the RTOs.

Next week’s post will take a deeper look at the value and benefits as well as the objections that some have to the RTO model.


References:

1. In this discussion the terms RTO and ISO are used interchangeably.

2. The Street, Entergy Utilities Proceed With Key Step towards MISO Integration, December 2012.

3. The Lane Report, East Kentucky Board Approves Integration Into Regional Transmission Organization, February 2013.

Posted in Electricity | Tagged , , | 1 Comment

Germany Provides Working Model for High-penetration Solar on the Distribution Grid

by Bob Shively, Enerdynamics President and Lead Instructor

Though in 2012 solar power made up approximately 0.1% of the  electric generation in the United States, solar output has increased sevenfold over the last five years. Is it possible that this growth could keep going to the point that solar becomes an important part of our generation mix?

The recent SunShot Vision study by the U.S.  Department of Energy (DOE) suggests yes. [1] Using a model that creates an economic dispatch stack for all types of generation resources, and assuming that current  government support such as the production tax credit will phase out as  currently scheduled, the study concluded that solar energy could meet as much  as 14% of U.S. electricity needs by 2030 and 27% by 2050. It should be noted that for this to occur,  significant cost reductions, grid improvement, and regulatory changes will be  required. But even less optimistic  assumptions for cost reductions in the study still led to solar being 4% to 17%  of U.S. generation output. [2]

Source: Energy Information Administration (EIA)

To think about whether such projections are realistic, it is useful to look elsewhere in the world for models. A good example of an electric grid where  solar power has become a large contributor is Germany, where during some hours  solar power already contributes as much as 40% of peak power demand and by 2012  was about 19% of Germany’s installed capacity. [3] This rapid growth in solar power was  stimulated by significant government subsidies, but the point of this article  isn’t to discuss whether or not subsidies are merited. Rather the point here is to examine the technical feasibility of such a large percentage of solar power connected  to our grid.

Source:  BP Statistical Review of World Energy 2012, except for 2012 which is taken from IEEE article cited in references

Issues with connecting solar power
Key needs from transmission and system operations standpoints  include:

  •  increased flexibility of non-solar generation (to handle supply  variability due to movement in cloud cover);
  • increased size of the  operational and planning area so that geographical diversity smooths  variability of output;
  • new transmission construction to bring in centralized  solar energy from remote locations;
  • and potentially the addition of storage.

The impact of these needs have been well  studied in the U.S. [4] with the conclusion that addressing the issues is feasible.

Less studied are the impacts on the distribution system  for solar photovoltaics (PV) connected to the local grid. Issues include reverse flows in the  distribution system, flows from distribution into transmission, and local grid  stability. When solar output on a  specific distribution circuit exceeds load on that circuit, electricity flows back  into transformers and substations. Often  the equipment has not been designed for these flows, and equipment trips and/or damage can result. In extreme cases,  reverse power flow can even result in power flowing from a distribution  substation into the transmission grid.  In almost no cases are systems in the U.S. currently designed for such  flows. And with large flows on local  grids, frequency or voltage instabilities can occur, especially since most  distribution lines are designed with the assumption that voltage falls as the  line gets further away from the substation. Such assumptions no longer work if  PV systems are injecting large amounts of power along the distribution  line.

Solutions to large amounts of distribution PV
So what has Germany learned about how to handle large  amounts of distributed PV? [5] Some problems can be solved by redesigning  and modifying the distribution system to handle reverse flows. This usually  involves replacing transformers and/or reinforcing distribution lines. But in some cases upgrades may not be the most  economic solution. Many of the issues can be dealt with by power conditioning  at the PV source. [6] For instance, interconnection requirements in  Germany mandate that PV systems support a smooth response to frequency  deviations through electronics installed on the PV system. Also, PV systems must  be able to control active and  reactive power output to help support local voltage.

To improve performance, distribution companies are experimenting with a number of potential solutions that may include decentralized or centralized control strategies that optimize through  communication among multiple PV systems. Optimal solutions are an issue for ongoing development.  But the conclusion is that the German  grid has, and will continue to, work with high penetrations. It just takes a lot of distribution  engineering to pull it off.

What this means for the U.S.
The U.S. distribution system is designed a bit differently than systems in Europe. For instance,  the U.S. tends to locate transformers closer to provide residential power at a  lower voltage. So solutions developed in  countries such as Germany will have to be reviewed. But there is no reason to think that what  Germany can do, the U.S. can’t. If  economics do result in a significant build out of solar power, there is reason  to believe that hard work by distribution engineers can result in a system that  continues to be highly reliable.


References:

1. http://www1.eere.energy.gov/solar/sunshot/vision_study.html

2.  For a good discussion of the SunShot Vision study, see IEEE Power and Energy  magazine, March/April 2013, pgs. 22-32.

3.  See IEEE power & energy magazine, March/April 2013, p. 55-6.

4.  See for instance, Transmission System Performance Analysis for High Penetration  Photovolatics, available at http://www1.eere.energy.gov/solar/pdfs/42300.pdf and Impact of High Solar Penetration in the Western Interconnection, available  at http://www.nrel.gov/electricity/transmission/western_wind.html

5.  For more details, see the IEEE power and energy magazine article previously  cited.

6.  By  power conditioning, we mean transformation of power from one  voltage/current/frequency/wave form to a different one

Posted in Electricity, Renewables | Tagged , , , , , , , | 1 Comment

What Can the Energy Industry Do About Hackers and Cyberspies?

by Bob Shively, Enerdynamics President and Lead Instructor

It seems you can’t turn on the news lately without hearing the latest report about hacking world and computerand cyberspies.  And sadly, digging beyond the news makes it appear that the issue isn’t just media hype.  For instance, Christian Science Monitor recently reported that cyberspies “targeted nearly two dozen U.S. natural gas pipeline operators over a recent six-month period, stealing information that could be used to sabotage U.S. gas pipelines, according to a restricted U.S. government report and a source familiar with the government investigation”[1].

And similar concerning events have occurred on the electric grid[2].  Clearly gas and electric infrastructure companies are scrambling to respond by beefing up security.  This is made more difficult by multiple factors including:

  • much of the IT systems used were designed before security was a high concern;
  • the push for smart grid has resulted in more and more portions of the grid being interconnected and thus potentially vulnerable;
  • and employees are using more and more interconnected devices at work and at home.

So how do companies address cyber security?  The SANS Institute [3], a cooperative research and education organization that works with key government agencies and private organizations, has developed a framework that identifies 20 key steps:

English: A candidate icon for Portal:Computer ...

  1. Inventory of authorized and unauthorized devices on the network
  2. Inventory of authorized and unauthorized software on the network
  3. Set secure configurations for all hardware and software
  4. Perform continuous vulnerability assessment and remediation
  5. Install malware defenses
  6. Only buy new software that is designed for security and replace or rewrite existing software that isn’t
  7. Perform rigorous wireless device control
  8. Build and maintain data recovery capability
  9. Perform security skills assessment for all your workforce and require appropriate training to fill gaps
  10. Require and verify secure configurations for network devices such as firewalls, routers, and switches
  11. Continuously limit and control network ports, protocols, and services
  12. Control use of administration privileges
  13. Maintain boundary defenses between internal and external devices
  14. Continuously maintain, monitor, and analyze security audit logs
  15. Control access based on need to know
  16. Monitor and control employee accounts
  17. Identify, monitor, and protect critical databases
  18. Develop incident response capability
  19. Design for secure network engineering
  20. Perform penetration tests and attack drills

If this sounds like a lot of work, it is.  But the alternative is to risk making the headlines as being the first energy provider brought down by a cyber attack.

Posted in Electricity, Natural Gas | Tagged , , , , , , | Leave a comment

LNG Rail, Trucking, and Shipping Soon to Be Common?

by  Bob Shively, Enerdynamics’ President and Lead Instructor

Low North American natural gas prices continue to fundamentally change the future of energy.  In Enerdynamics’ blog, we’ve already talked about the shift to gas-fired LNGelectricity generation[1], development of Compressed Natural Gas (CNG) vehicles[2], and the growth of natural-gas intensive manufacturing[3].  But yet another development is gaining momentum as some big players move forward with developing Liquefied Natural Gas[4] (LNG) as a transport fuel.

The difficulty with using natural gas as a transport fuel is that natural gas at normal temperatures and pressure is not dense enough for it to be practical to hold the fuel in a tank on a vehicle or ship.  One way to deal with this is to compress the gas to raise its pressure so that more gas will fit into the practical volume of a vehicle tank.  Typical pressures are above 3,000 pounds per square inch (psi).

To get a sense of what this means, the pressure can be compared to the one-quarter psi (pressure in common residential use). An alternate is to use LNG, which can operate at relatively low pressures of 70 to 150 psi.  Instead of a thick tank that can hold the high pressure of CNG, vehicles instead need an insulated tank that keeps the gas cool.

A key problem with widespread adoption of LNG for transport is the lack of fueling infrastructure, which makes it impractical if users can’t count on being able to get fuel wherever they need to go.  Thus the first widespread use may come from uses such as rail locomotives which could be served by an infrastructure centralized under one owner.  BNSF Railway has announced a plan for introducing pilot LNG locomotives this year[5].  According to the Wall Street Journal, use of LNG for locomotives “would usher in one of the most sweeping changes to the railroad industry in decades.”[6]

Shell is attempting to address the fueling issue for the trucking industry by investing its own money to build out infrastructure in key areas.  Shell has begun implementation in initial key trucking corridors. In 2011 Shell started in Alberta, Canada, in a partnership with Flying J Truck stops.  To provide the LNG, Shell built a small LNG plant in Alberta[7].  In 2012 Shell announced a plan to provide LNG at over 100 TravelCenter of America (TA) sites in a Great Lakes corridor[8].  And in March of 2013, Shell announced plans to develop two LNG liquefaction plants – one in Ontario to supply the Great Lakes corridor and a second in Louisiana with a focus on shipping in the Mississippi River and the Gulf of Mexico[9].

Combined with efforts elsewhere in the world, multiple sizeable parties in the U.S. are attempting to take a leadership position in transitioning LNG to a widespread transport fuel. If they or others are successful, we will soon see natural gas making major new inroads in markets now dominated by petroleum-based fuels.


References

[4] Liquefied Natural Gas, or LNG as it is commonly called, is natural gas cooled below the point where is changes from gas to a liquid.  At typical pressures, this occurs at about -260 degrees Fahrenheit.  The advantage of LNG is that gas shrinks in volume by a factor of about 600 when liquefied, thus making it practical to transport the fuel in fuel tanks.

Posted in Natural Gas | Tagged , , , , , , , , | Leave a comment

Why Close a Perfectly Good Nuclear Power Plant?

By Bob Shively, Enerdynamics President and Lead Instructor

Low natural gas prices continue to impact the U.S. electric markets in new and surprising ways.  While teaching a class recently, I was asked why Dominion Resources would be 88366706closing its Kewaunee nuclear plant in Wisconsin rather than simply selling the unit if they no longer wished to run it.  The questioner went on to say that, seeing as the unit is already in place and should have very low variable costs, why wouldn’t someone want to keep it running and bid the energy into Midwest ISO (MISO) markets to presumably make money?

At the time, I didn’t have a good answer.  So I decided to do some research and find out.  And the bottom line answer is that the market believes power can currently be obtained more cheaply in other ways than by owning and running a nuclear unit.

A short history of Kewaunee
First, a bit of history. The unit was put on line in 1974.  Dominion purchased the 568 MW Kewaunee plant from Wisconsin Public Service and Alliant Energy for $192 million in 2005. As part of the deal, the two sellers agreed to purchase power from the unit through December 2013.  After buying the unit, Dominion applied for and recently received an extension of the unit’s operational license allowing the unit to operate through 2033.  Soon after receiving the extension Dominion decided that Kewaunee no longer fit its strategic plans and attempted to find a buyer.  But no buyer came forward, and in October 2012 Dominion announced it would close the unit by mid-2013 rather than continue to operate it[1].

Finally in February of this year, MISO announced that the unit’s closure would not result in system reliability issues and could close as proposed.  According to Dominion chairman, president, and CEO Thomas Farrell:  “This decision was based purely on economics. Dominion was not able to move forward with our plan to grow our nuclear fleet in the Midwest to take advantage of economies of scale. In addition, Kewaunee’s power purchase agreements are ending at a time of projected low wholesale electricity prices in the region. The combination of these factors makes it uneconomic for Kewaunee to continue operations.”

So why no buyers?
Which leads us back to the question – why was existing nuclear power not an attractive investment in Kewaunee’s case?  The answer is that low wholesale power prices driven by low natural gas prices and an influx of wind power may no longer support enough revenue to cover the fixed costs of running the plant plus the required return on investment for any buyer. And since fixed costs don’t necessarily decline much as unit sizes decline, this can be especially problematic for smaller units like Kewaunee since they have fewer MWh to spread fixed costs over.

This may not be a big concern if the unit has fixed costs covered under regulated utility rates.  But when a company like Dominion runs a unit as a merchant plant, variable costs, fixed costs, and investment return have to be covered through market-based revenues.  Some markets have a capacity payment that units receive for simply providing reliable capacity to the market and then also receive revenues from energy sales. But in MISO, capacity revenues are relatively small, meaning Kewaunee was looking at future of depending on market-based energy revenues once the existing power purchase agreements expired in 2013.MISO Indiana Hub Average Energy Prices

Source:  FERC January 2013 Market Snapshot Midwest Version[2]

Looking at energy prices at the most commonly traded Midwest point, MISO’s Indiana Hub, we can see that prices have dropped significantly in the last three years.  And given MISO’s method of using a location marginal price, average prices in Wisconsin are even lower.  So for a nuclear unit that might have a variable operating cost of $20/MWh, there just simply may not be enough revenue left to make the unit a reasonable investment.  Clearly that is what potential buyers concluded.

Does this apply to other units?
Dominion was quick to point out that they still believe in nuclear power, and Farrell was quick to say that  “The situation Dominion faces at Kewaunee is the result of circumstances unique to the station and do not reflect the nuclear industry in general.”

But others have expressed concerns that merchant units may find it harder to make sufficient revenues in times of low market prices.  Entergy’s CEO Leo Denault recently stated on an analysts call that some of its nuclear merchant units are “in challenging economic situations”.[3]  In the longer term, keeping existing nuclear units open helps diversity of fuel, keeps down greenhouse gas emissions, and supports grid reliability. And in the long-term existing units may prove to be good investments assuming power prices rise in the future.  But in the short-term, shareholders of merchant power companies may not care to wait if they perceive that other more attractive investments are available. So we will need to watch the situation to see if other nuclear units may face the same fate as Kewaunee.

Posted in Electricity, Energy Training | Tagged , , , , , , , , | Leave a comment